Introduction
This article aims to provide some quick jump-in tips to Google Analytics (GA) beginners, for those who want a complete step-by-step tutorial, you may want to check out the official GA beginner course.
Like many other Google tools, GA is extremely powerful, and yet the UI is a bit untrivial to beginners, to say the least. That may explain why Google even build a course for that. But once you got some sweet spot of GA, you could explore the remaining features yourself with relative ease.
To learn GA, or any other data mining tool, there are two basic prerequisites that help people kick start:
- You need a bunch of data for you to play around
- You need a bunch of real data so it makes your study interesting
For item 1, fortunately GA provides a bunch of demo data for everyone, free.
Click the link below to get the access to the GA demo data https://analytics.google.com/analytics/web/demoAccount
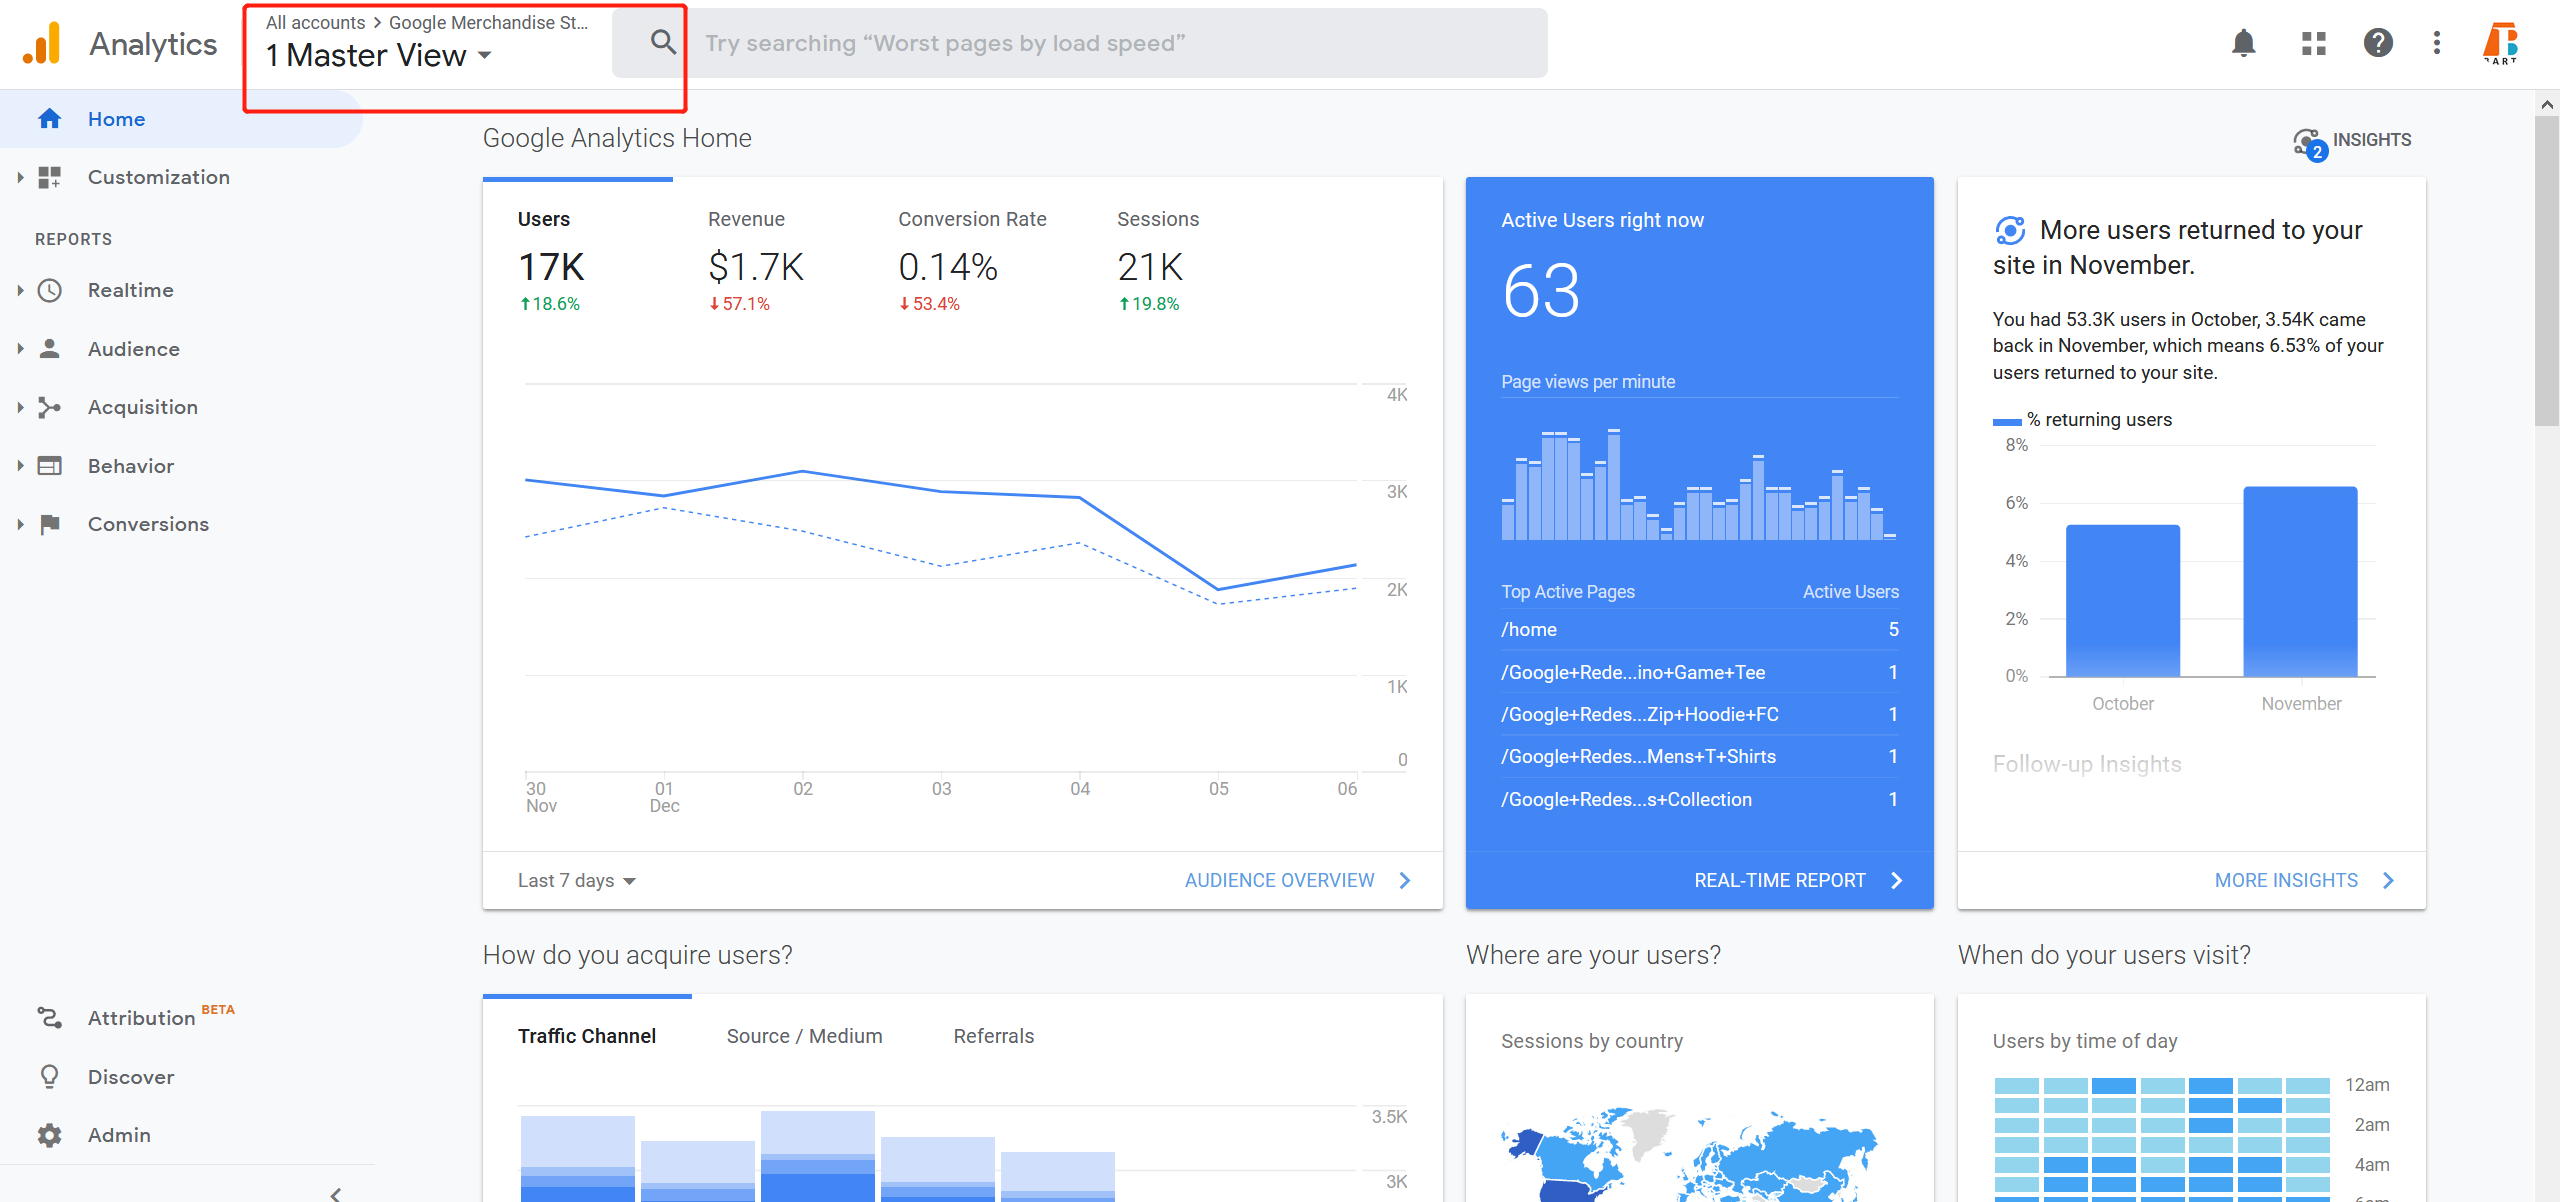
Then click the Demo account from the top bar, you will see this:
Item 2 is actually the most difficult part, this means unlike learning a new programming language, you actually need some real data to start working out something useful.
Put a GA tracking code into a website is out of scope, but there are a bunch of tutorials outside. It’s extremely easy to plant one into your site. If you use a WP site, it’s even simpler. All it takes is to simply install a wordpress plugin, and do a Google login, you don’t even need to know the tracking code value.
Main Sections
Quick Takeaway
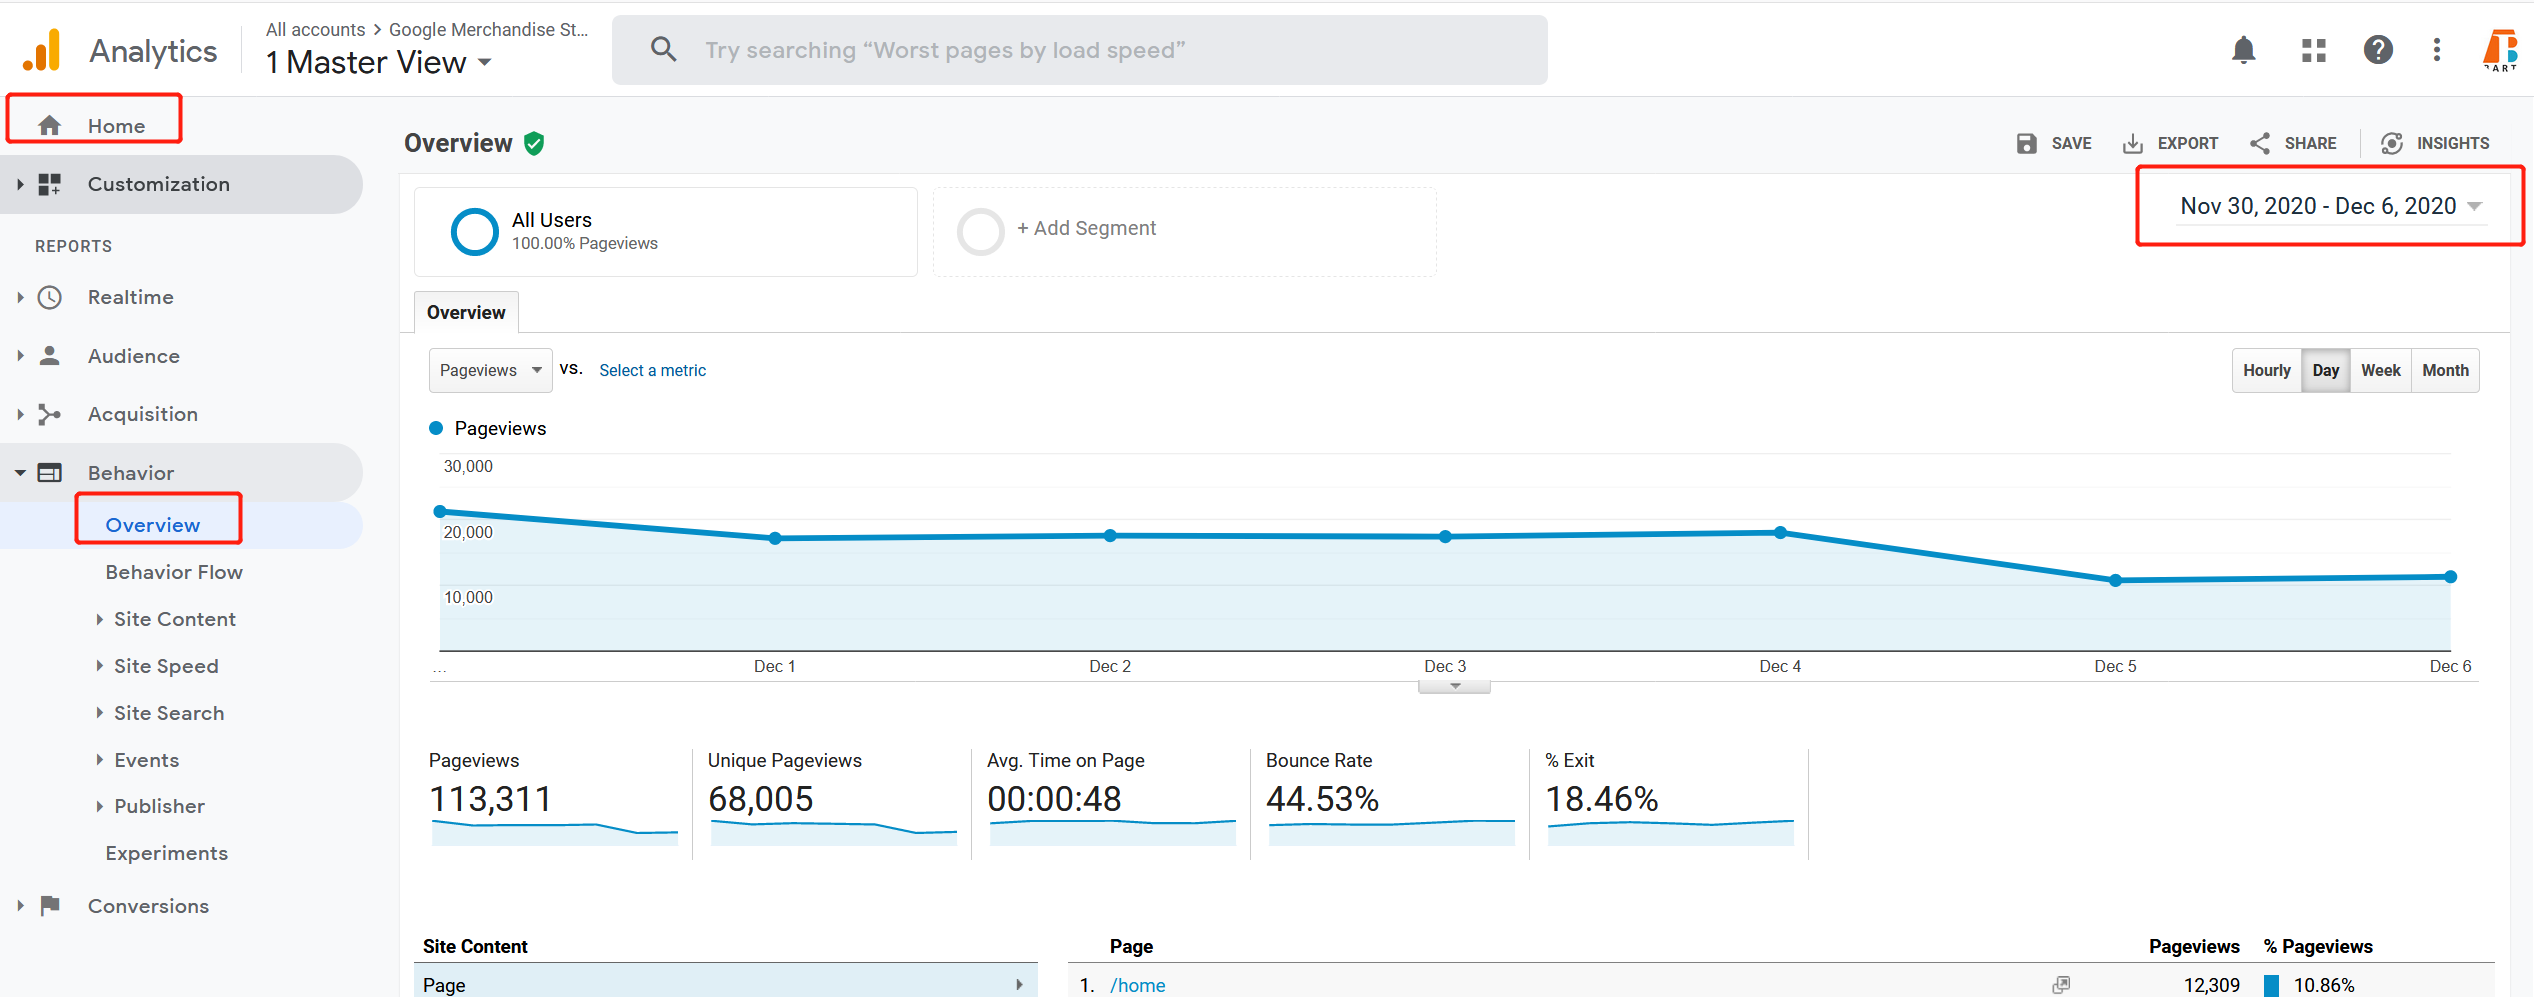
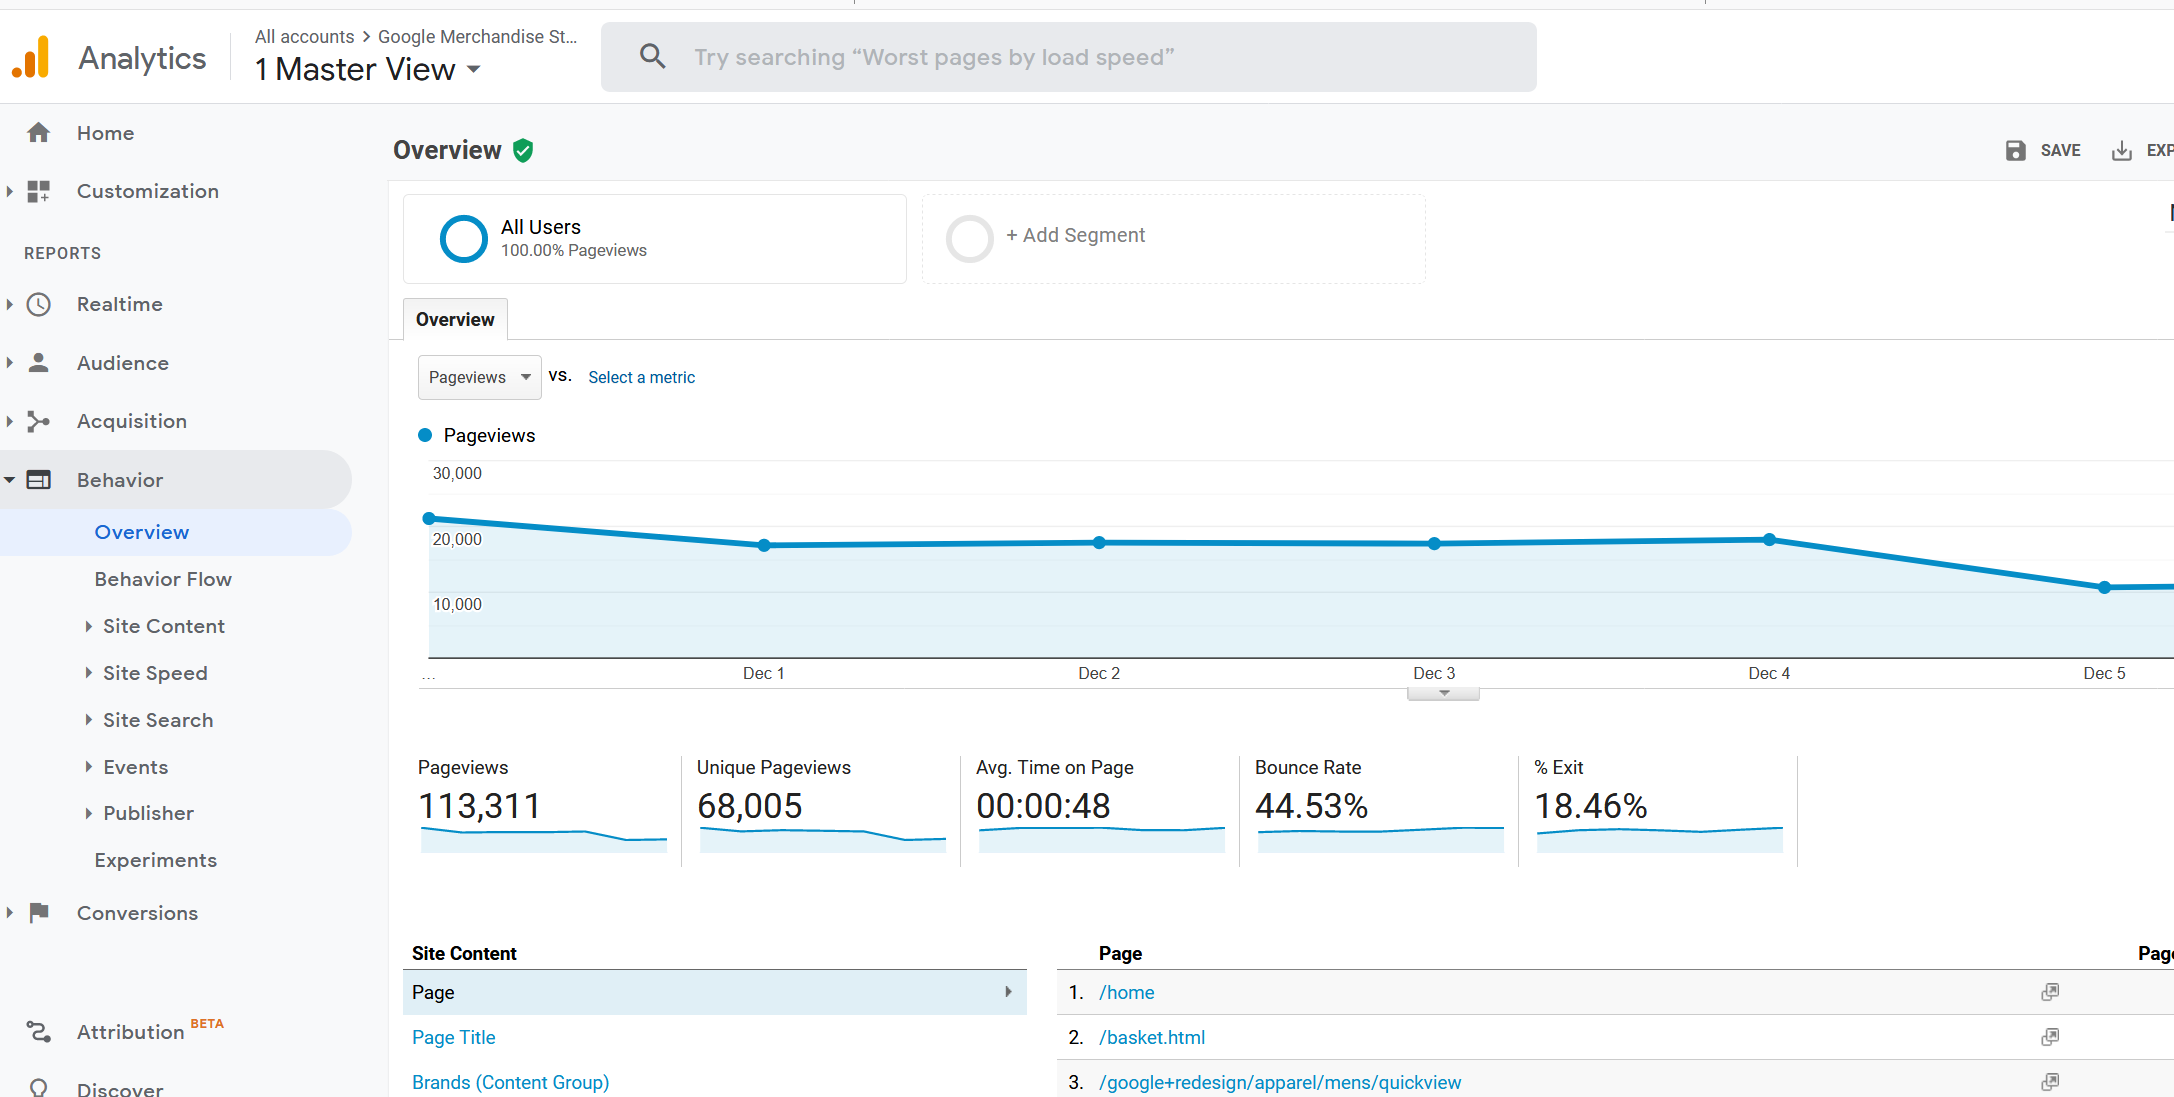
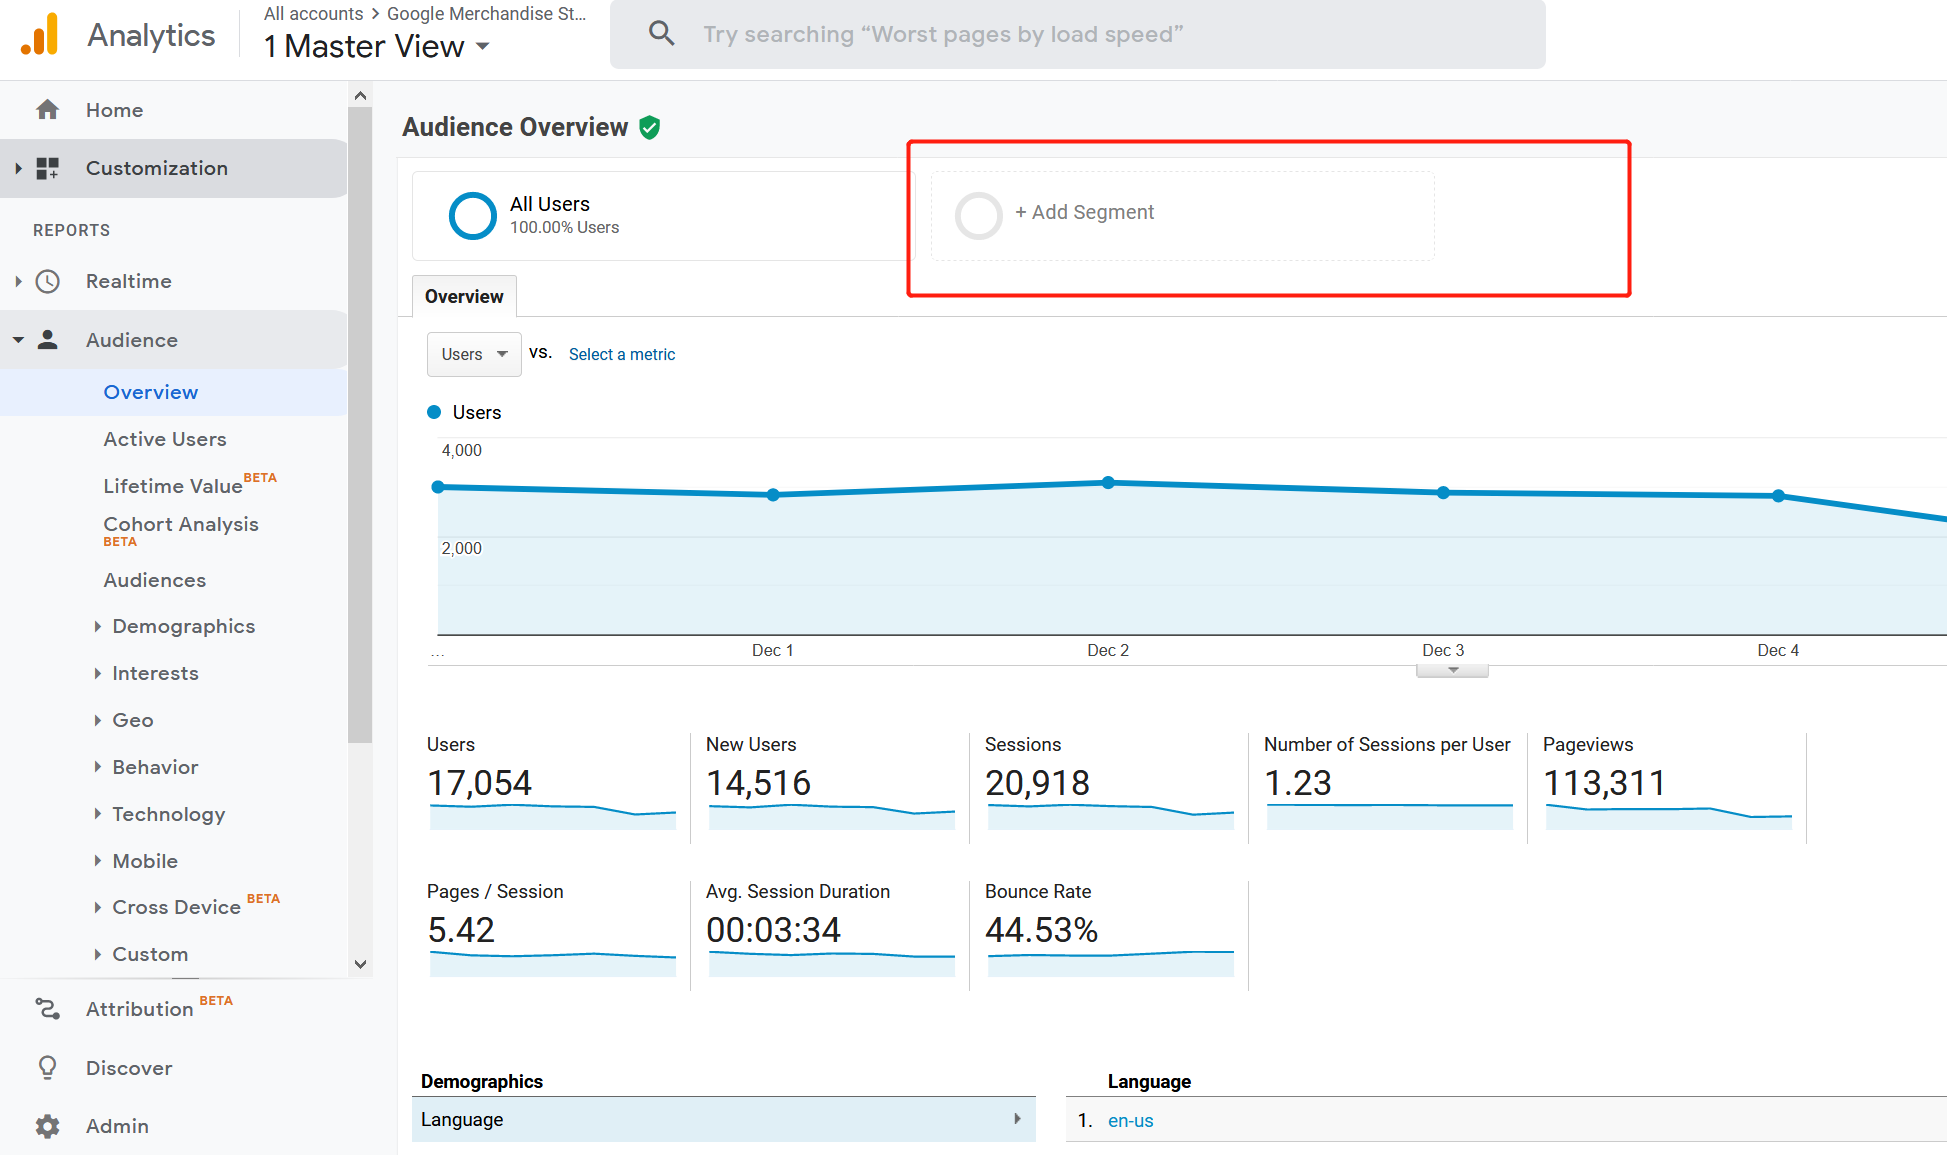
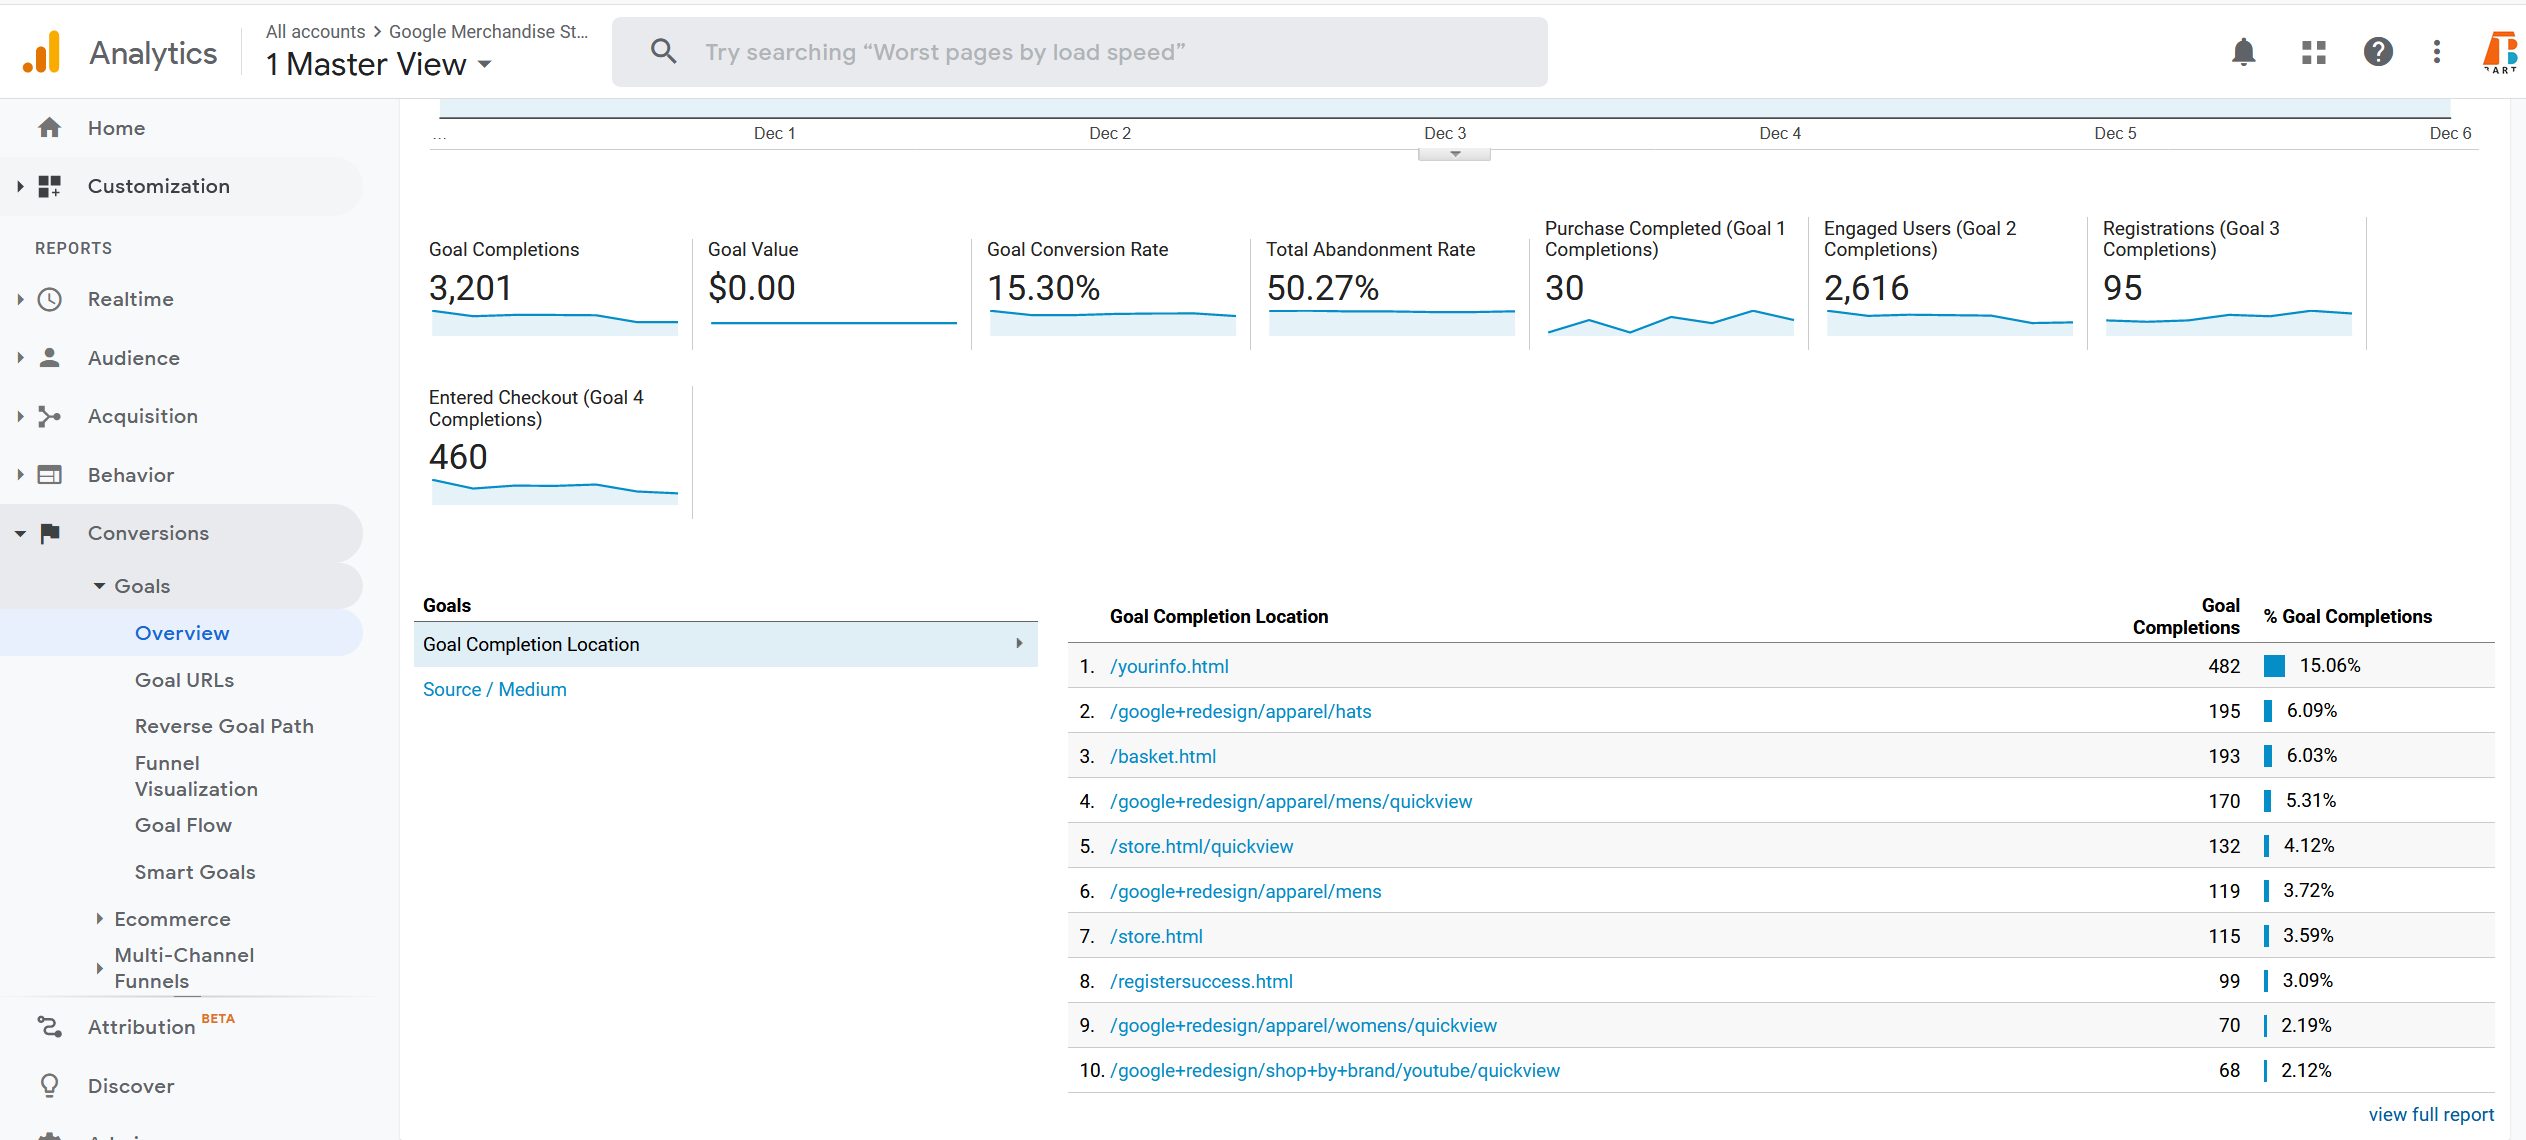
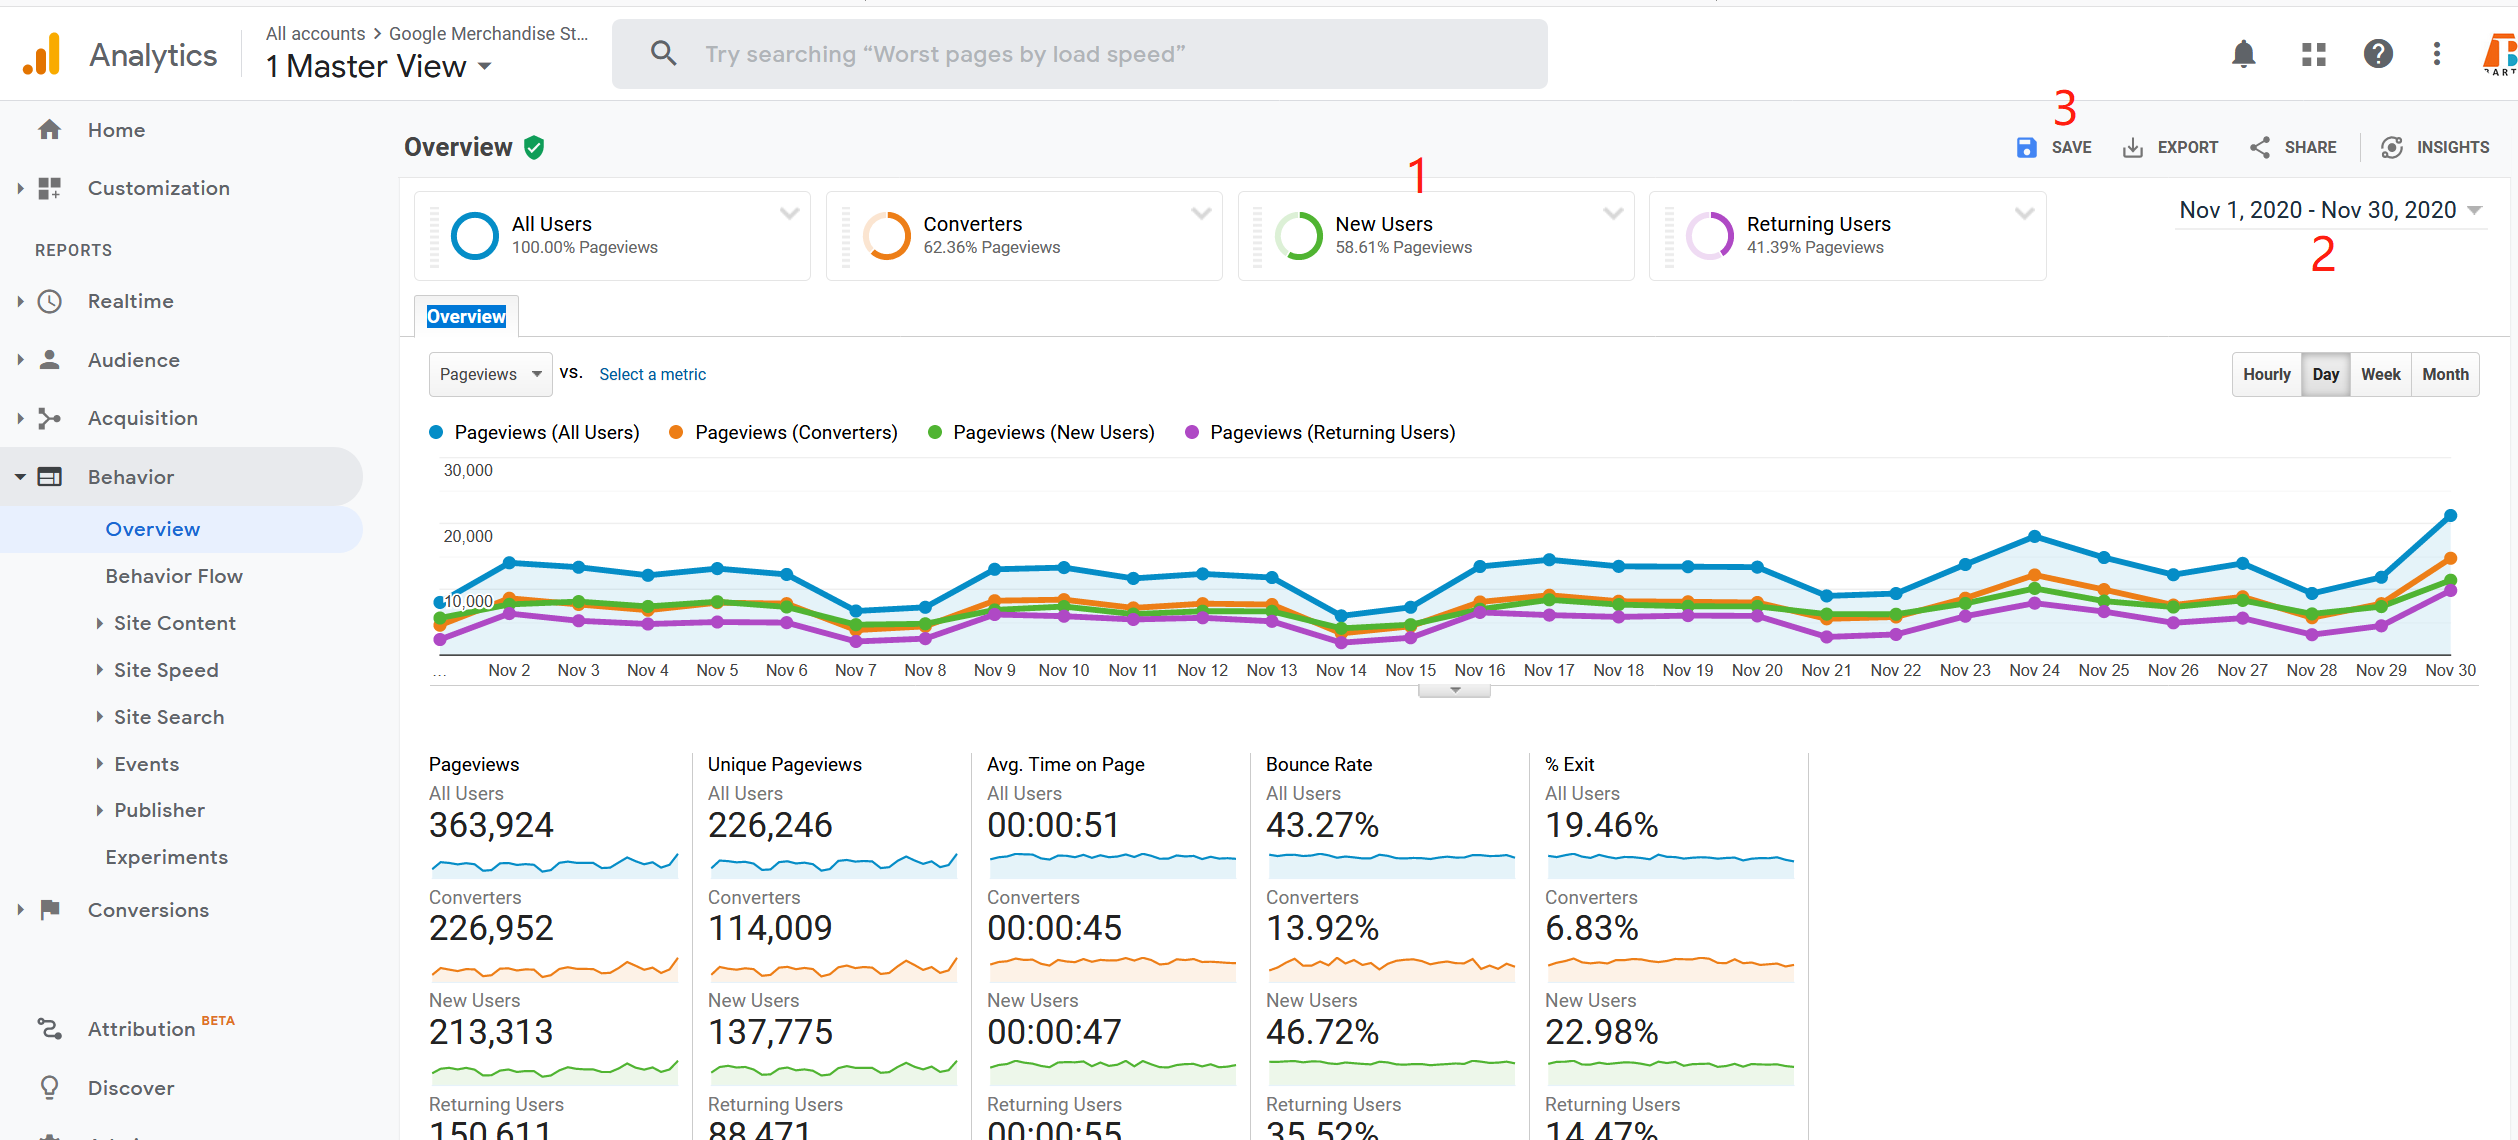
- Overview of each section shows a consolidation of each section
- The home screen is a further consolidation of all section overviews
- You could always change the date range by clicking the top right corner of screen
There are four main sections of GA:
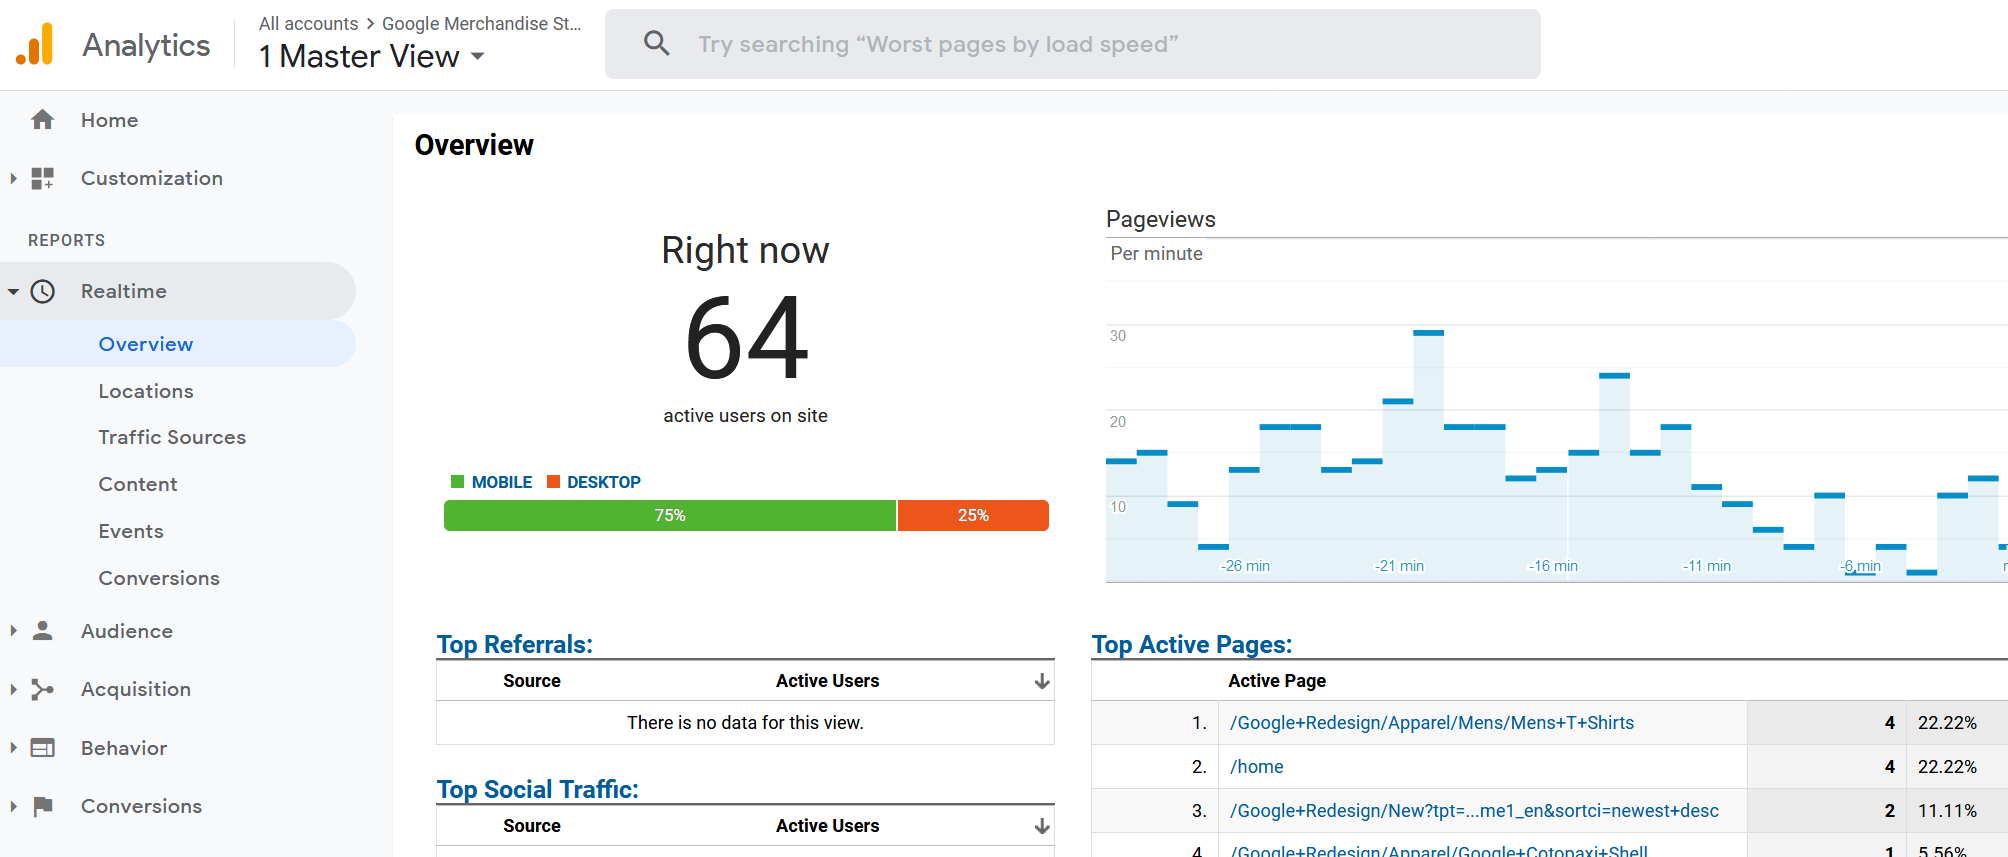
- Real time data
- Audience
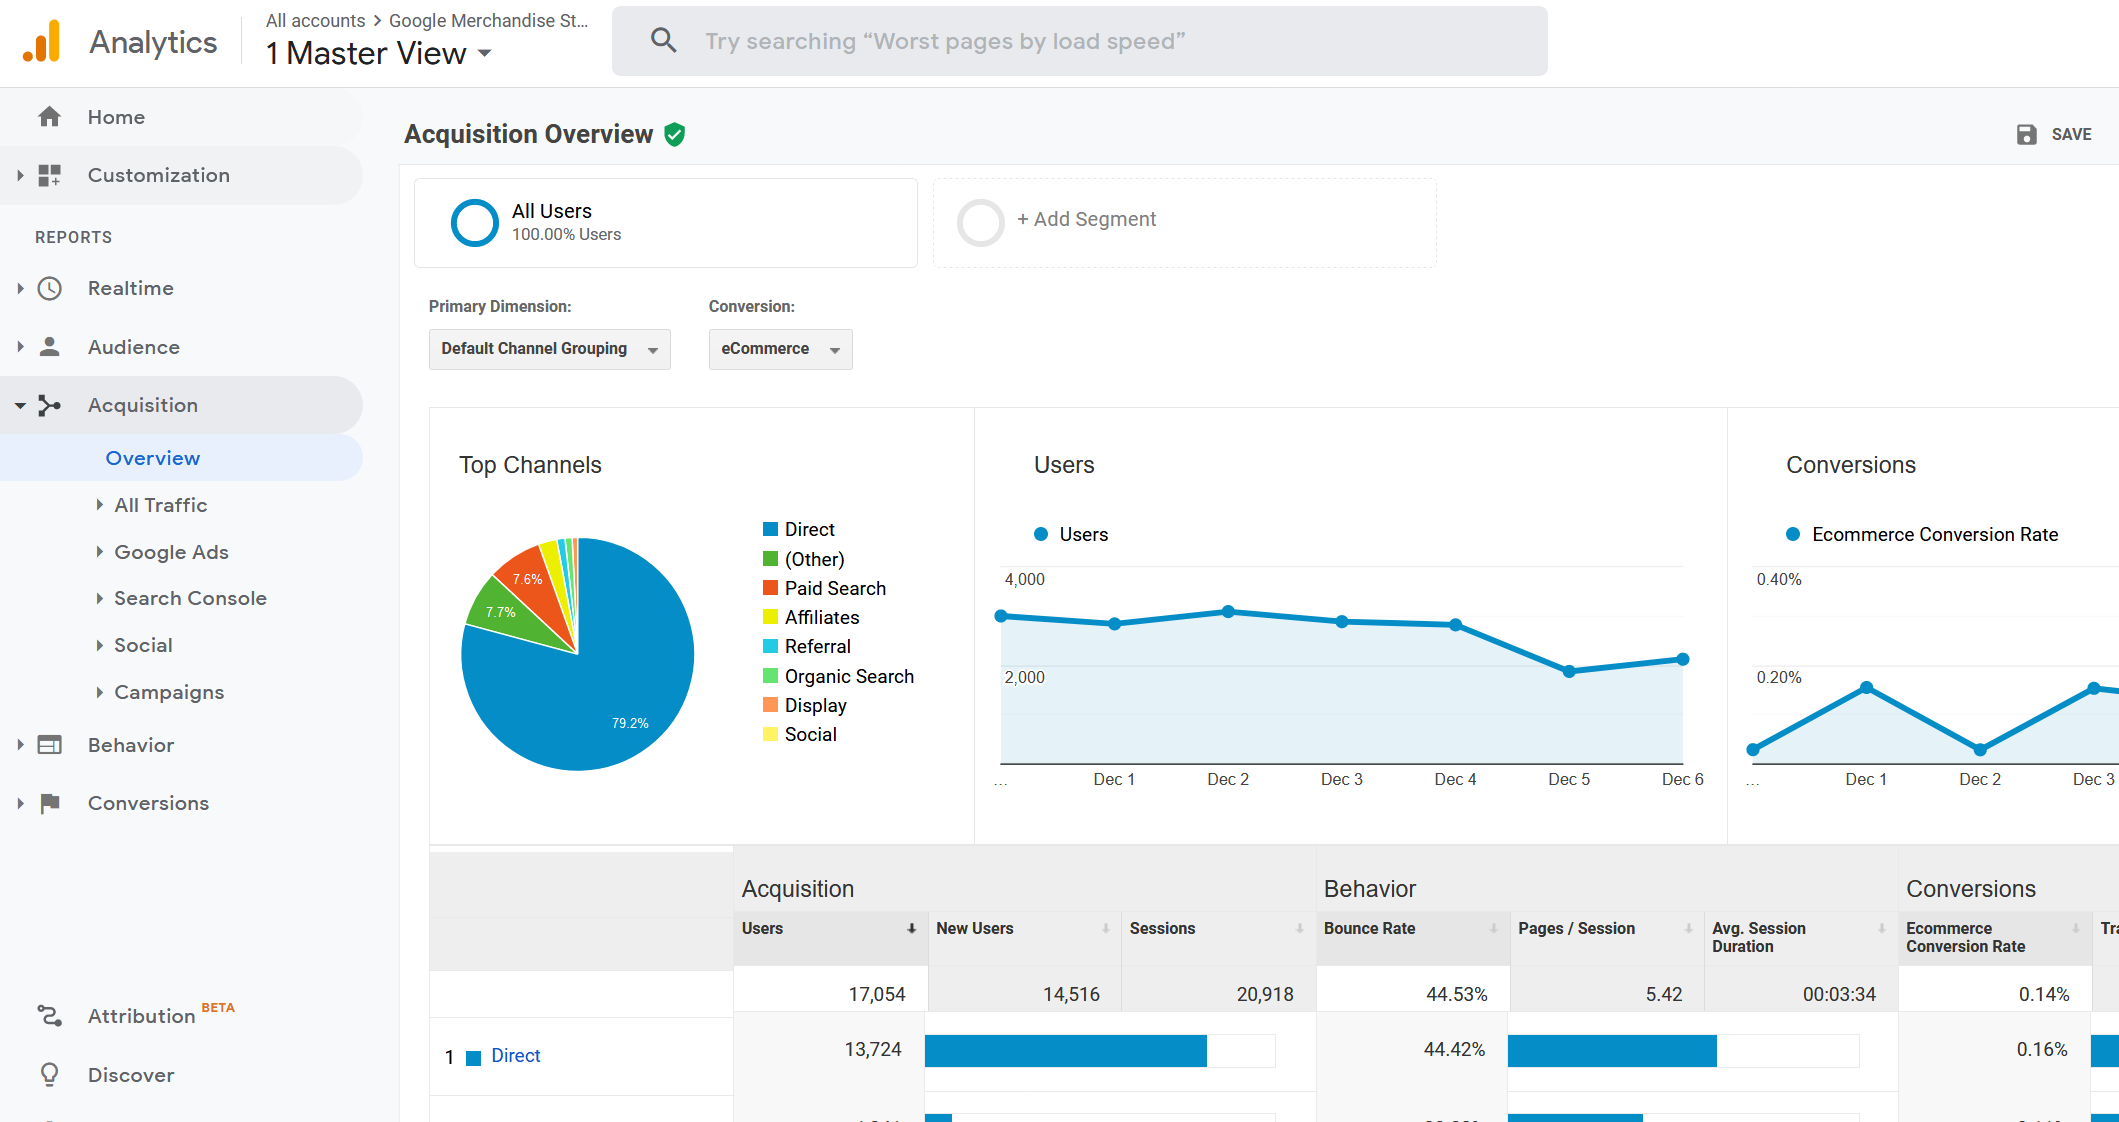
- Acquisition
- Behaviour
- Conversions
The four sections are more or less related, and directly map to marketing concepts. For easier understanding, the sections could be re-ordered into this way:
- Real time data - which page of your site has been visited since 30 minutes ago, this is the most direct indication of how busy your server is right now. It’s also useful to verify if the tracking code is correctly planted into the system. Normally, you don’t wait for 24 hours and see if if the tracking code is fine :)
- Acquisition - how people actually start to visit your site? Are they introduced from another site (referral), organic search or marketing campaigns?
- Behavior - Where do the people visit after they entered your site? Do they exit immediately? Do they get lost?
- Audience - Who are those visitors? How many of them are new users and how many are returned ones? (Need to update segments) You could learn more if you enabled audience demographics. It’s a bit aggressive, and they are never turned on in our Simple CRM products. But if you do, please make sure you notice the users beforehand, this is explicitly required by Google.
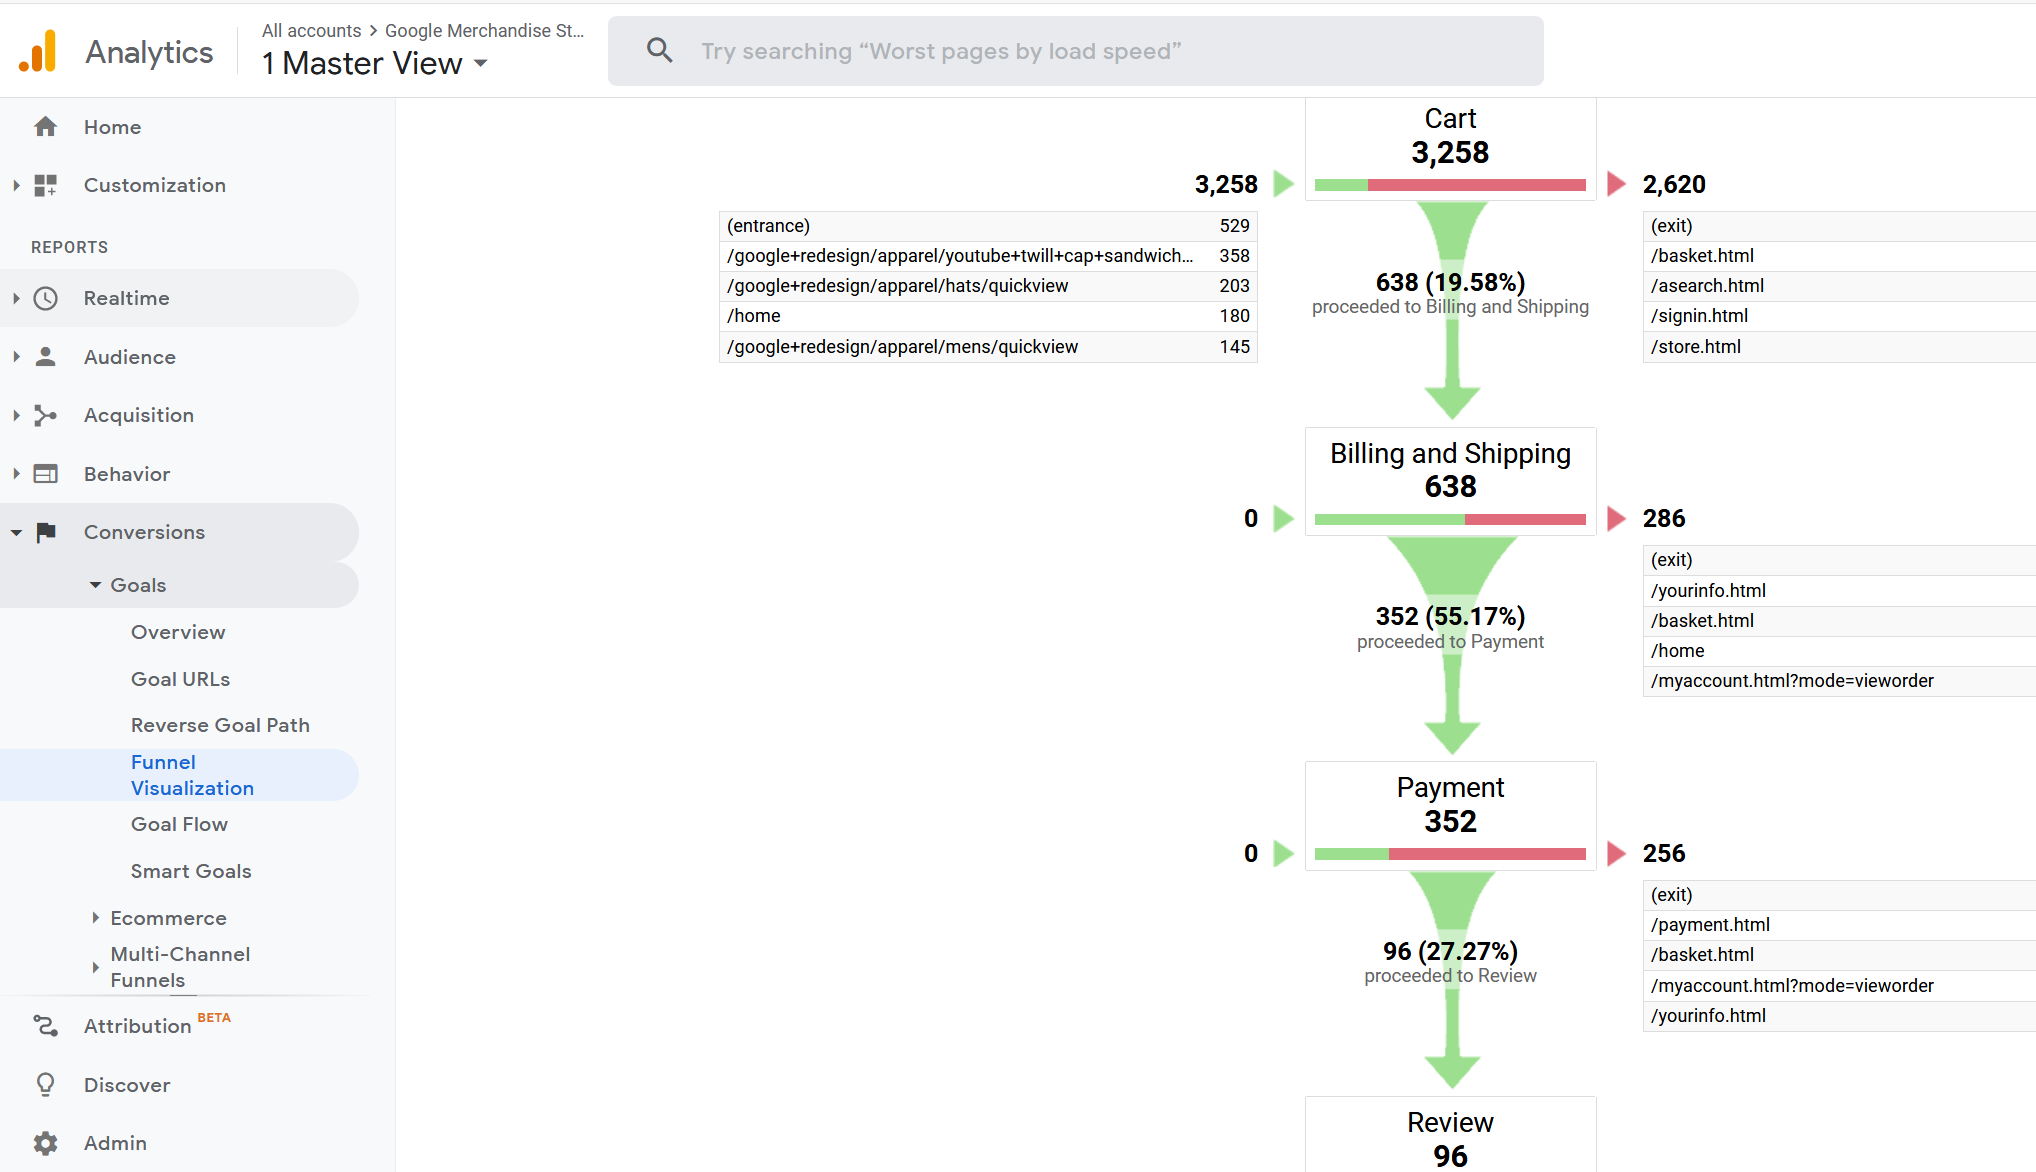
- Conversions - How do the visitors contribute to your revenue? You could set up some critical check points (goals) at different pages of your site, e.g. when user reached shopping card page, check out page, payment successful page, or sign up completion page. You may also find the view of funnel visualization interesting.
In most cases these overview screens are carefully tuned by Google, and supposed to provide most information to users, at a glance.
But in case that’s not enough, you may try to dig a bit deeper yourself.
You could always finetune the tables and reports, and save them for future uses:
Basic Play Around
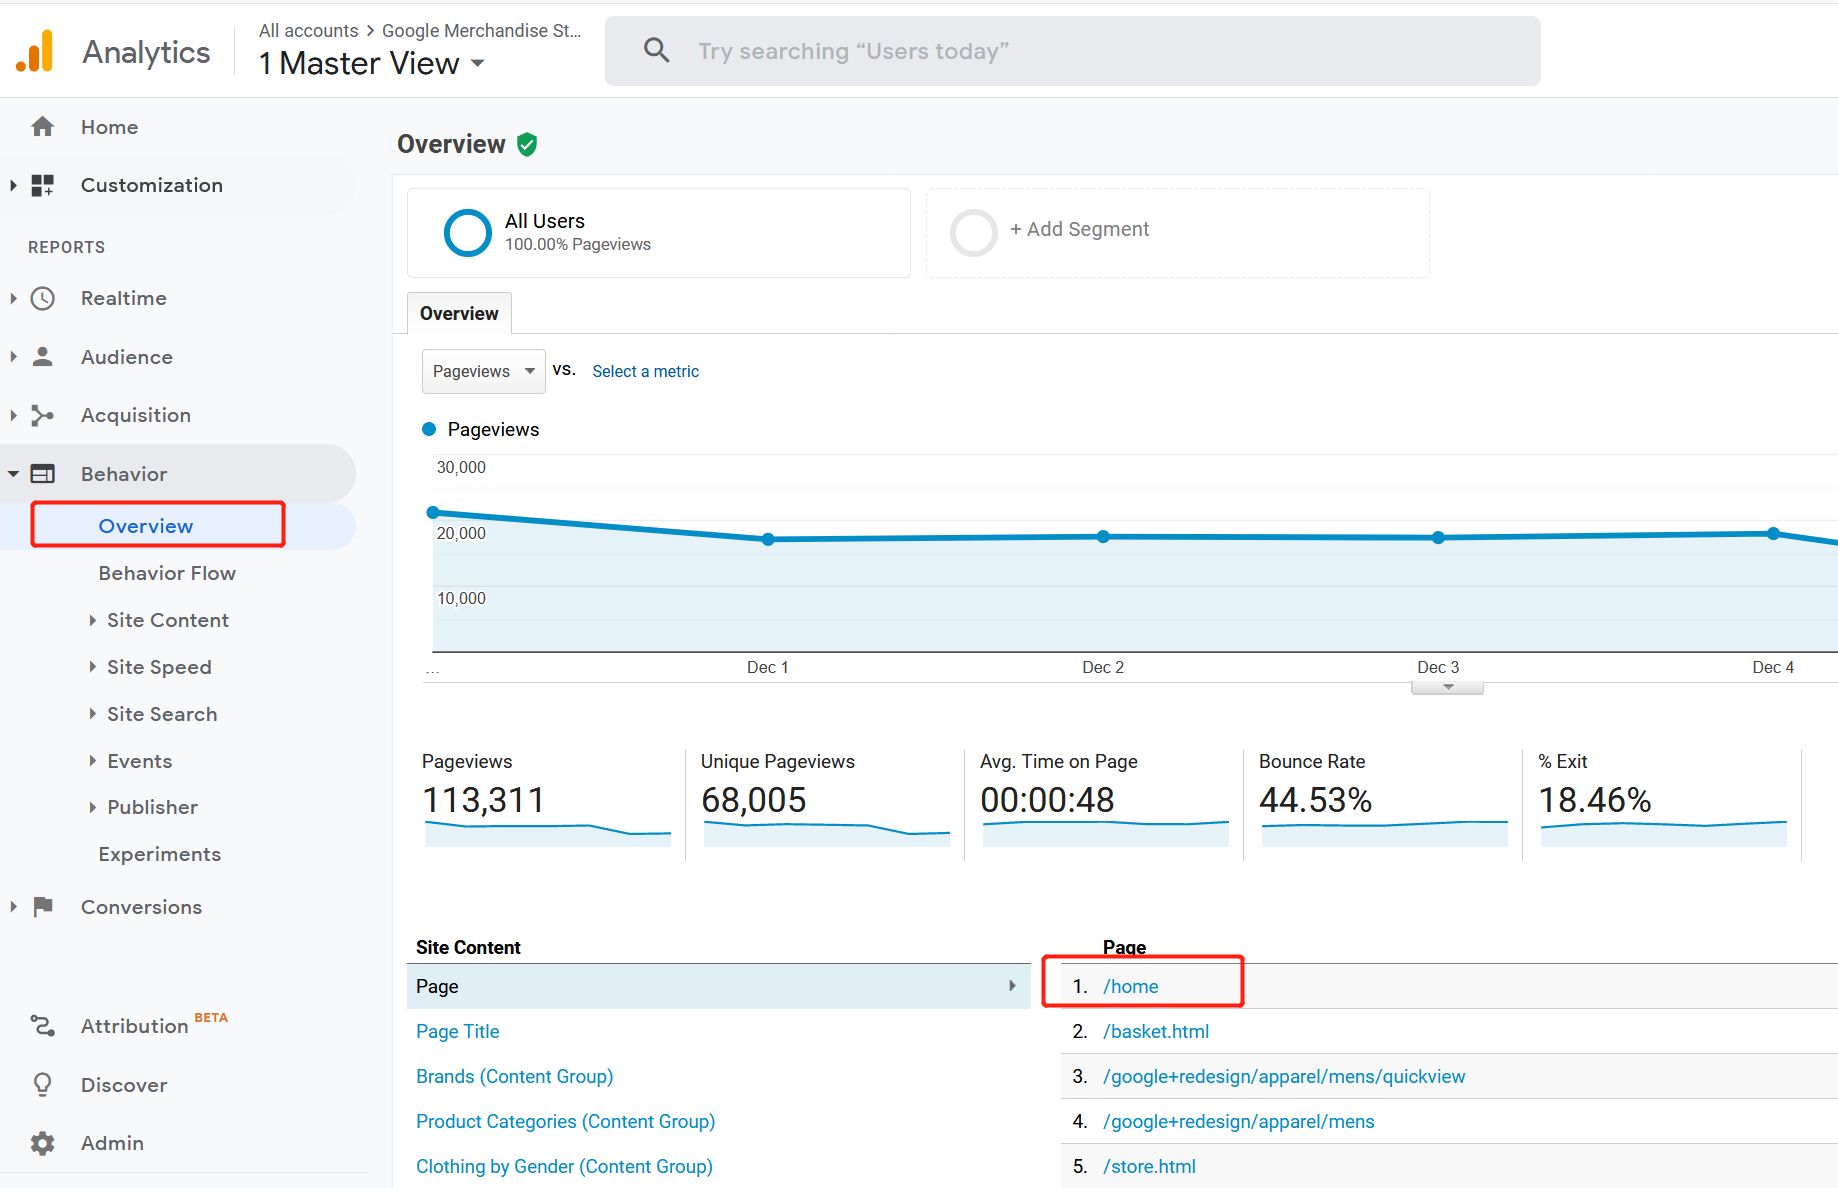
We would show how to play around the basic reports.
- Go to the overview of behavior page, and click the link of ‘homepage’, for which
we want further investigate:
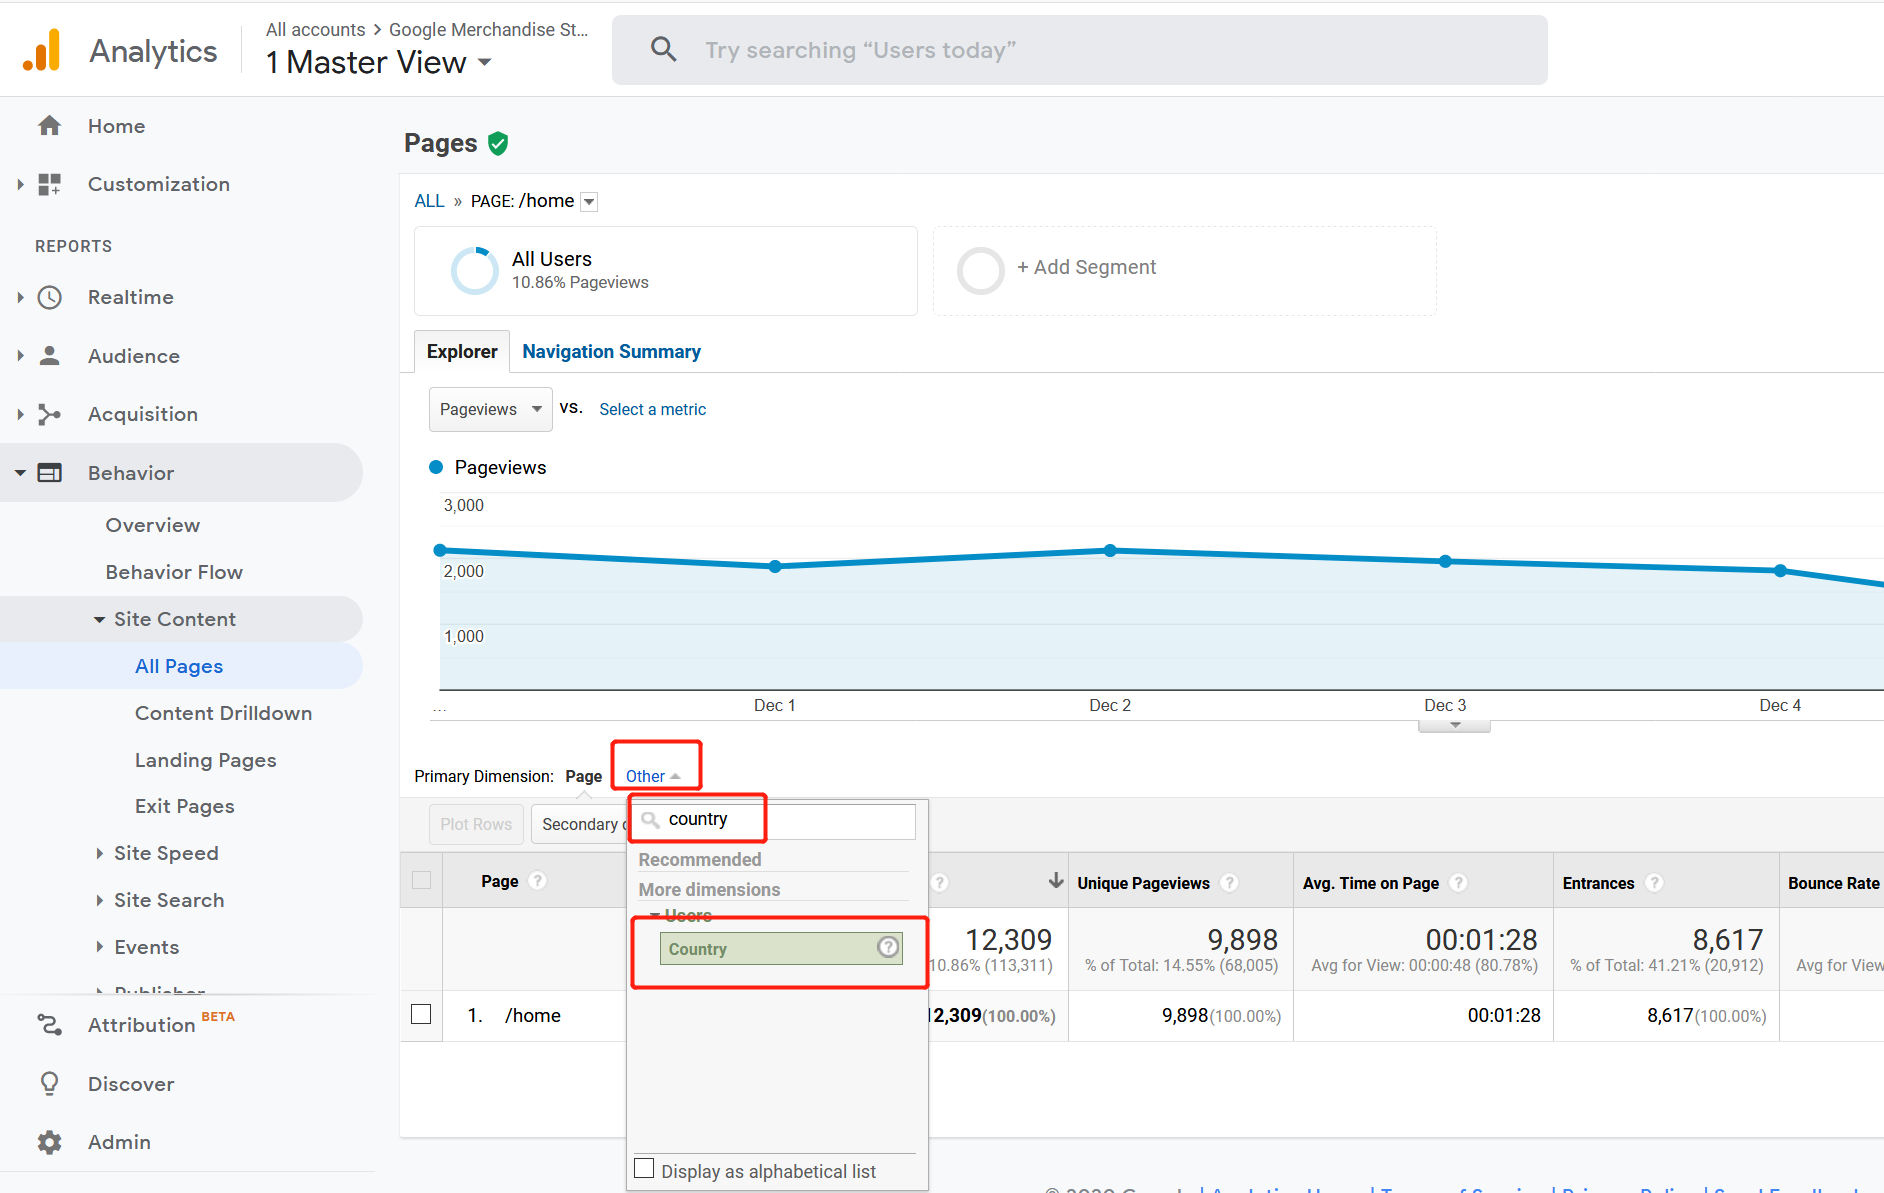
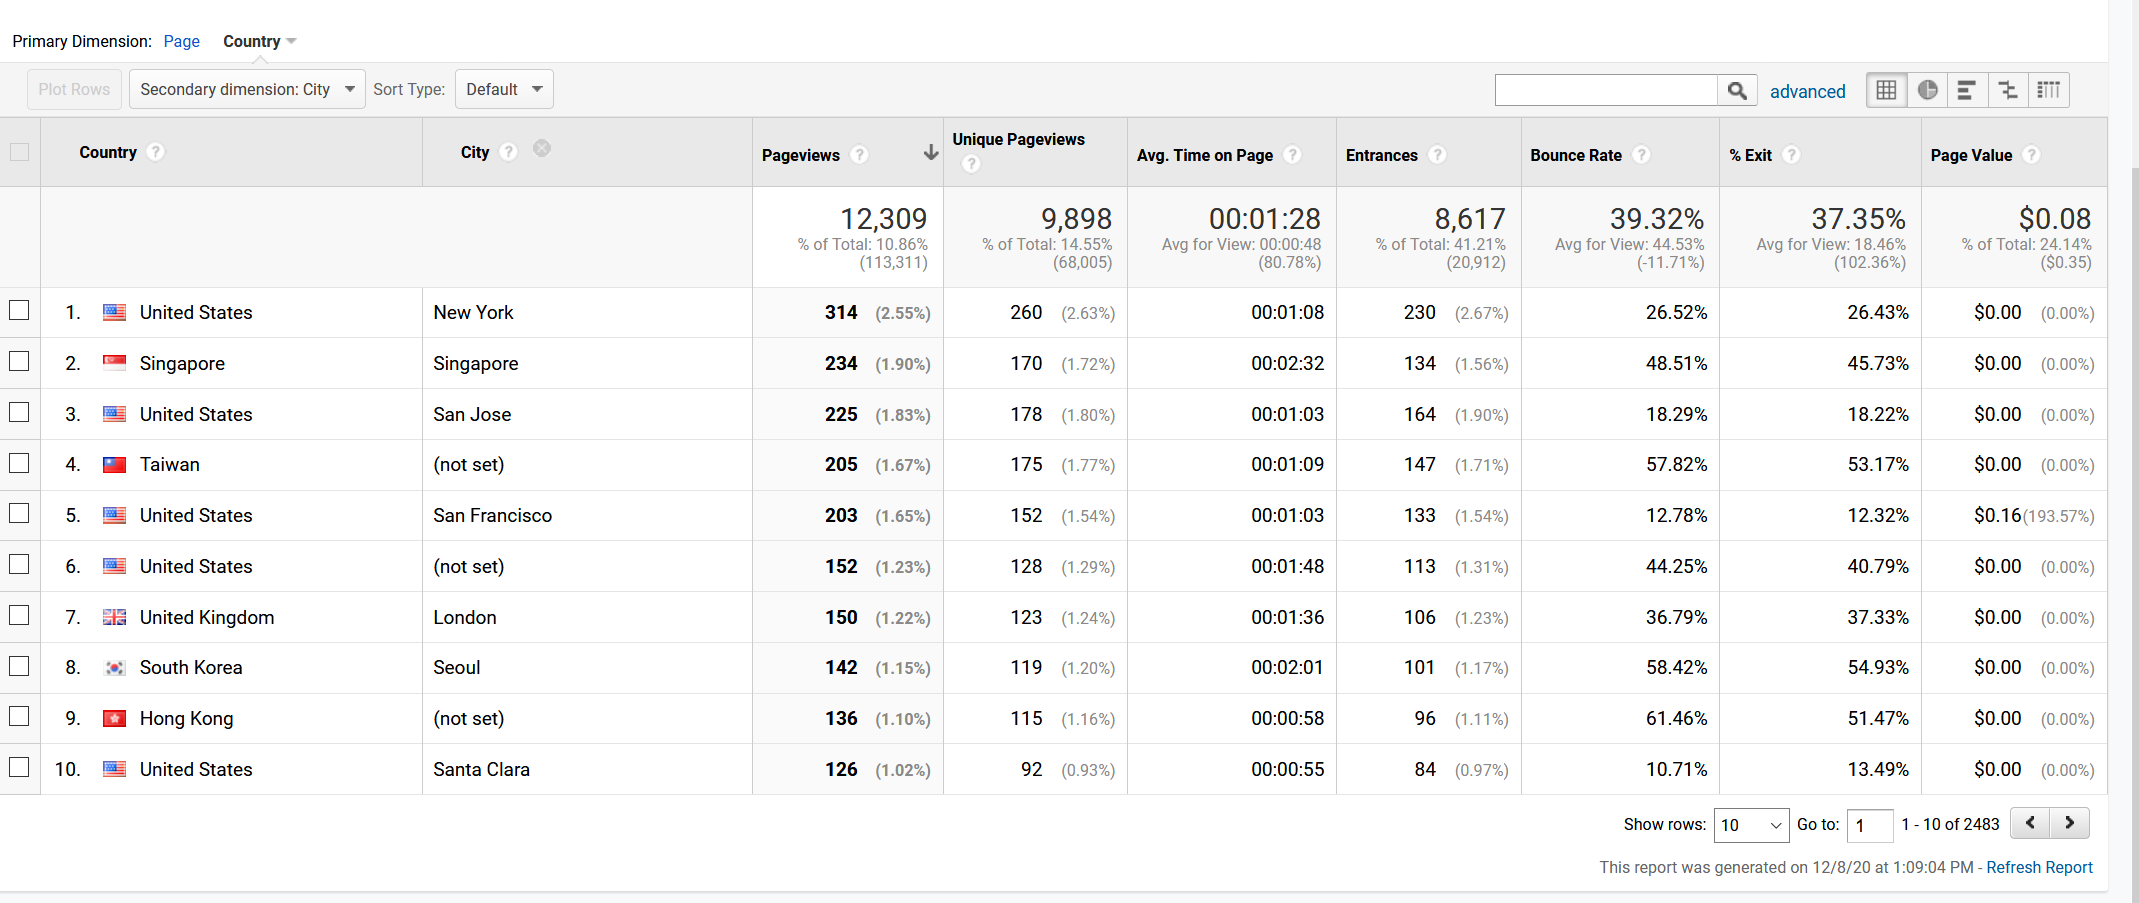
- Inside the page, we click ‘other’, then type ‘country’ to change the primary
dimension of the table. (Yeap, it’s not that trivial)
- Click ‘secondary dimension’, and select city.
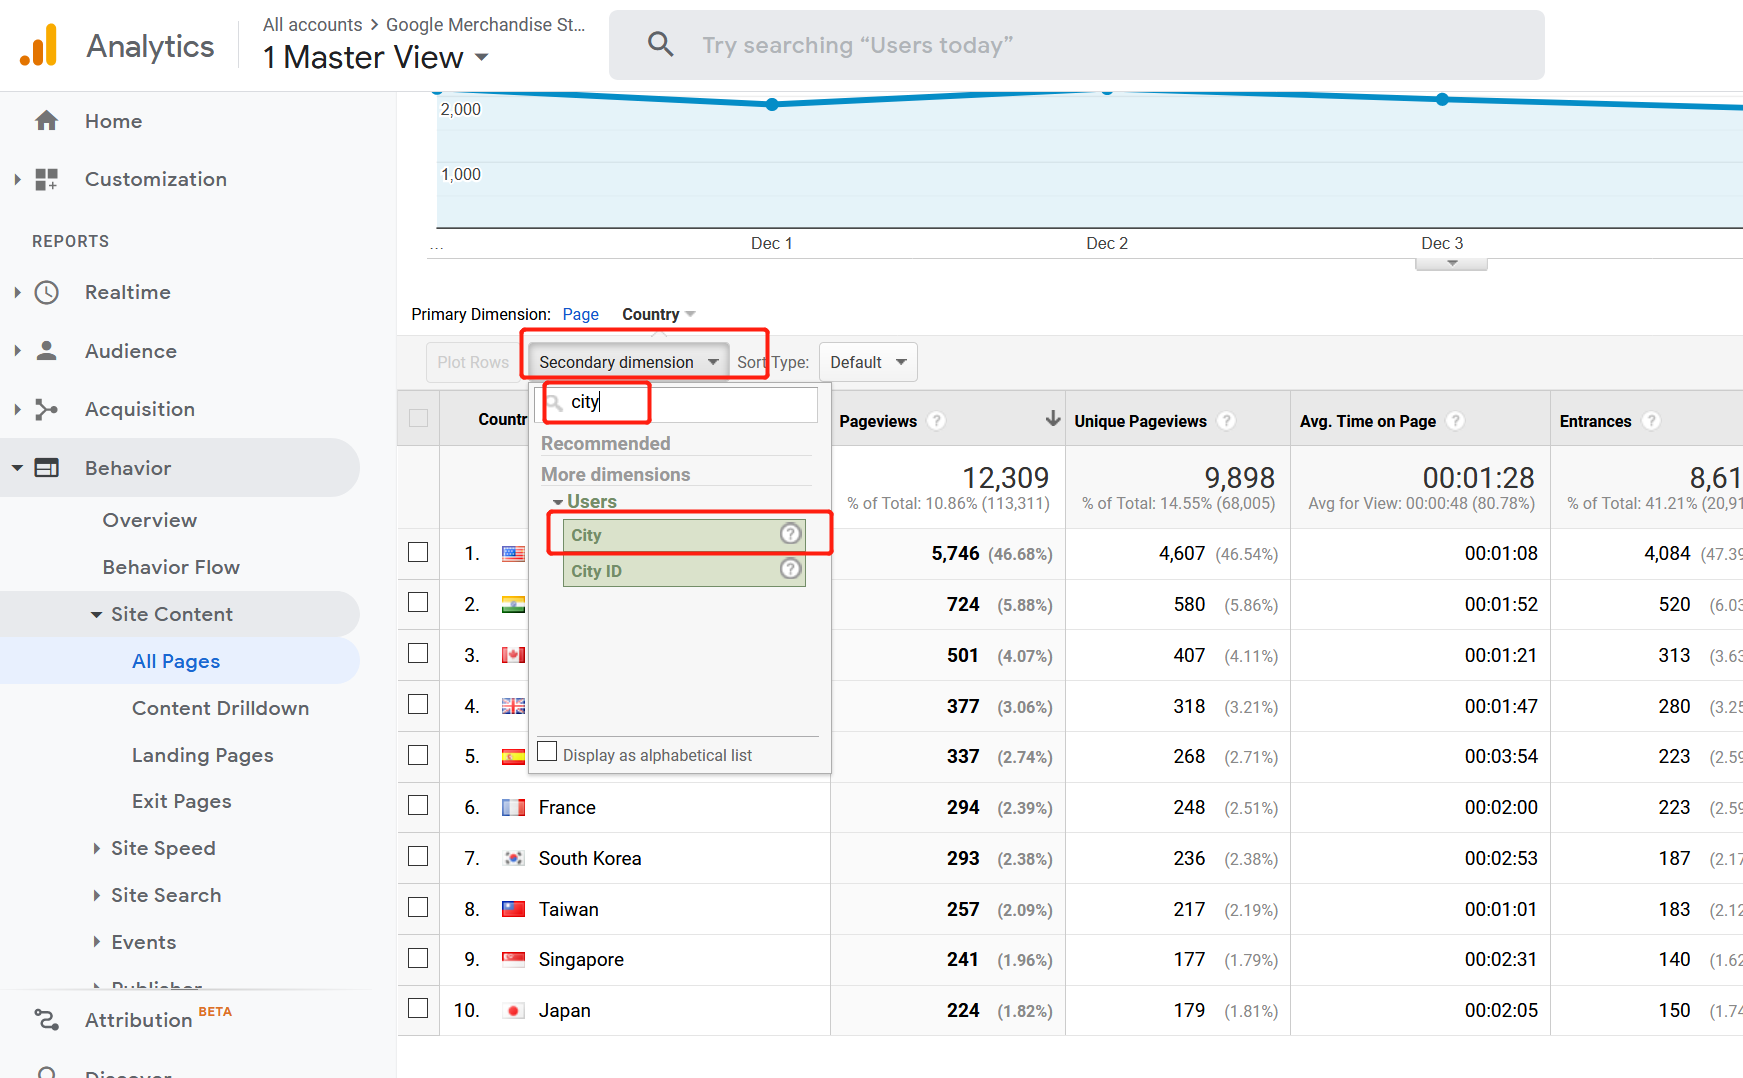
- Now we could see city of each visitor who arrived our homepage URL, and how
long they stayed on the page. This should help you with the campagin budget allocation.
Dig a Bit Deeper
Say, if also want to know, for the people of that city, do they tend to use desktop PC, or mobile device more? We could use another dimention of ‘operation system’ for that purpose. However, the basic report support at most two dimensions, so what should we do?
This is where pivot table comes in handy.
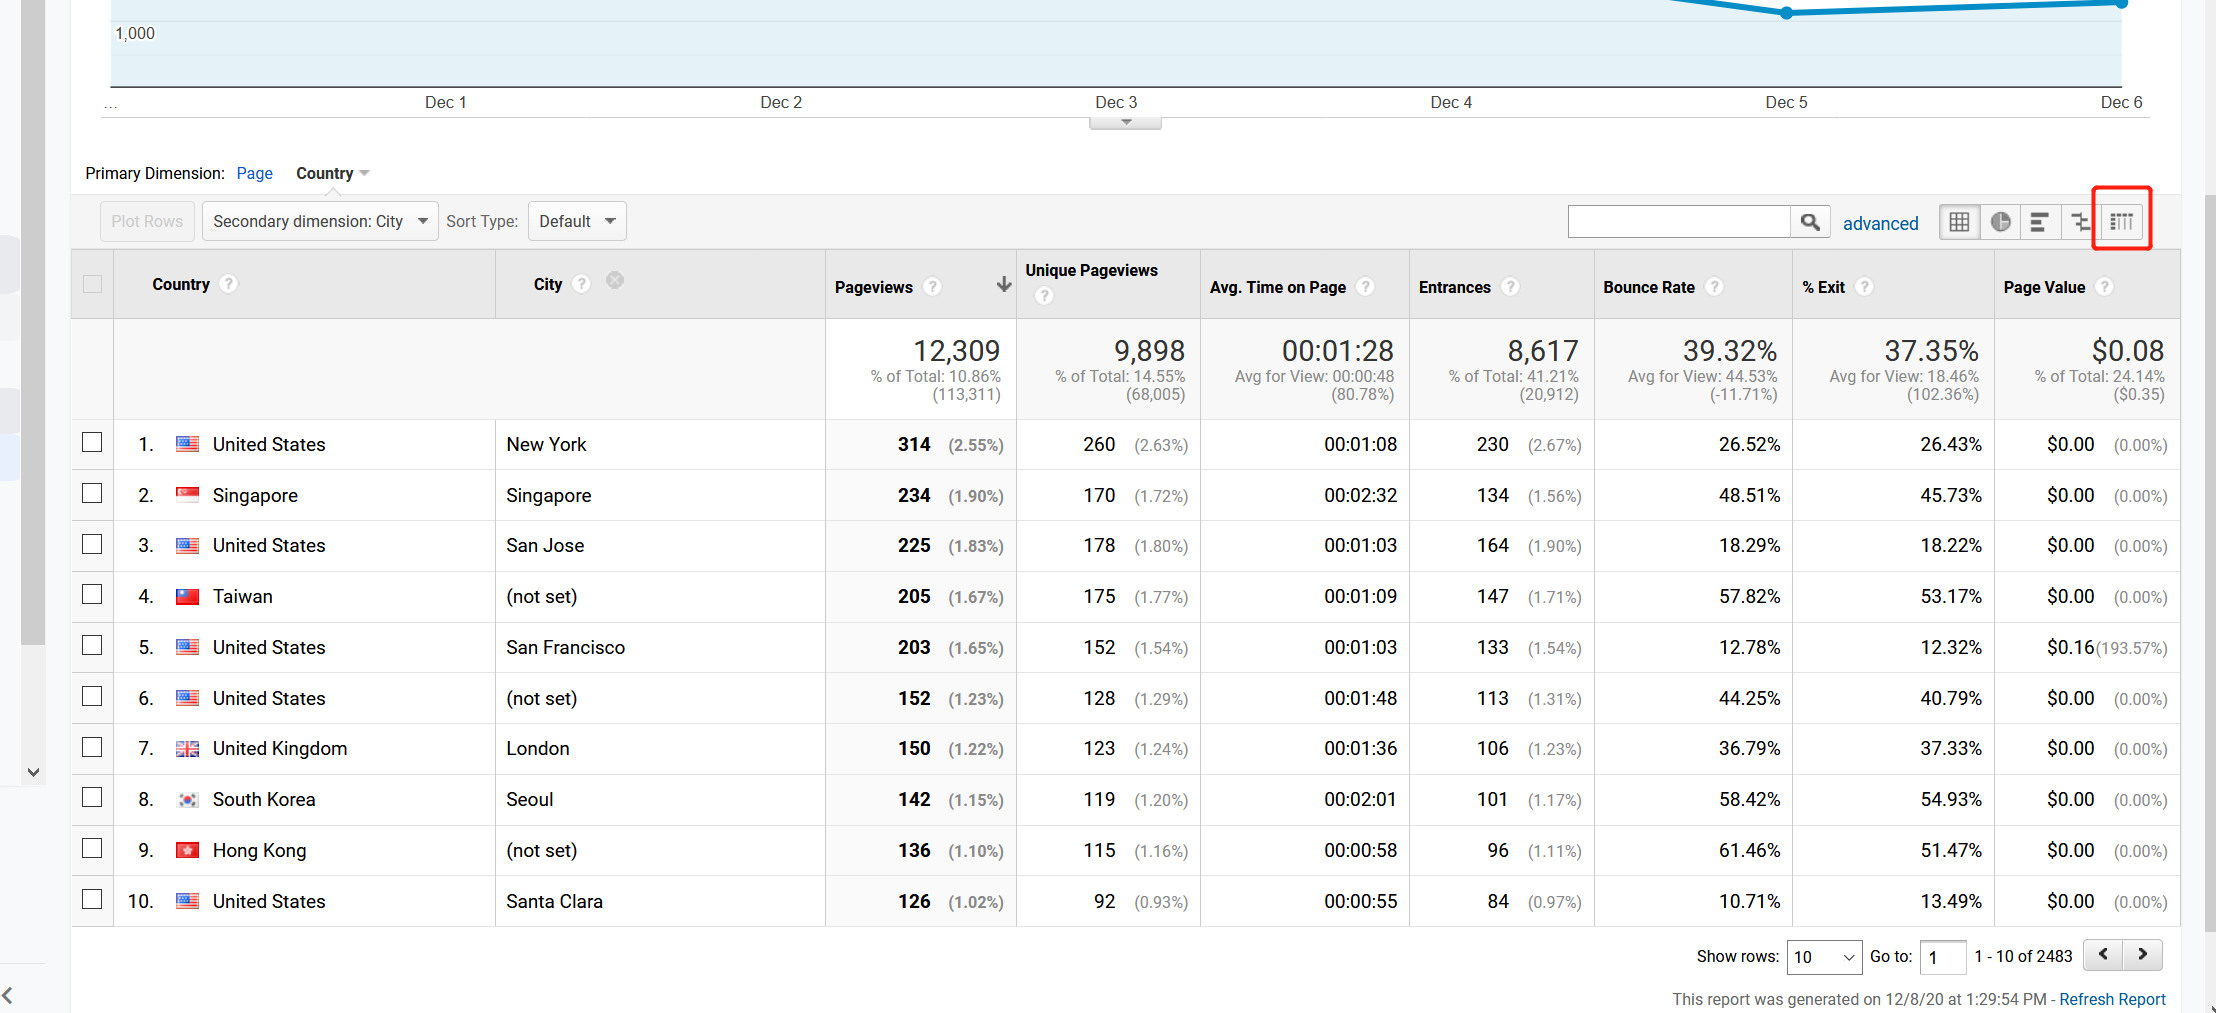
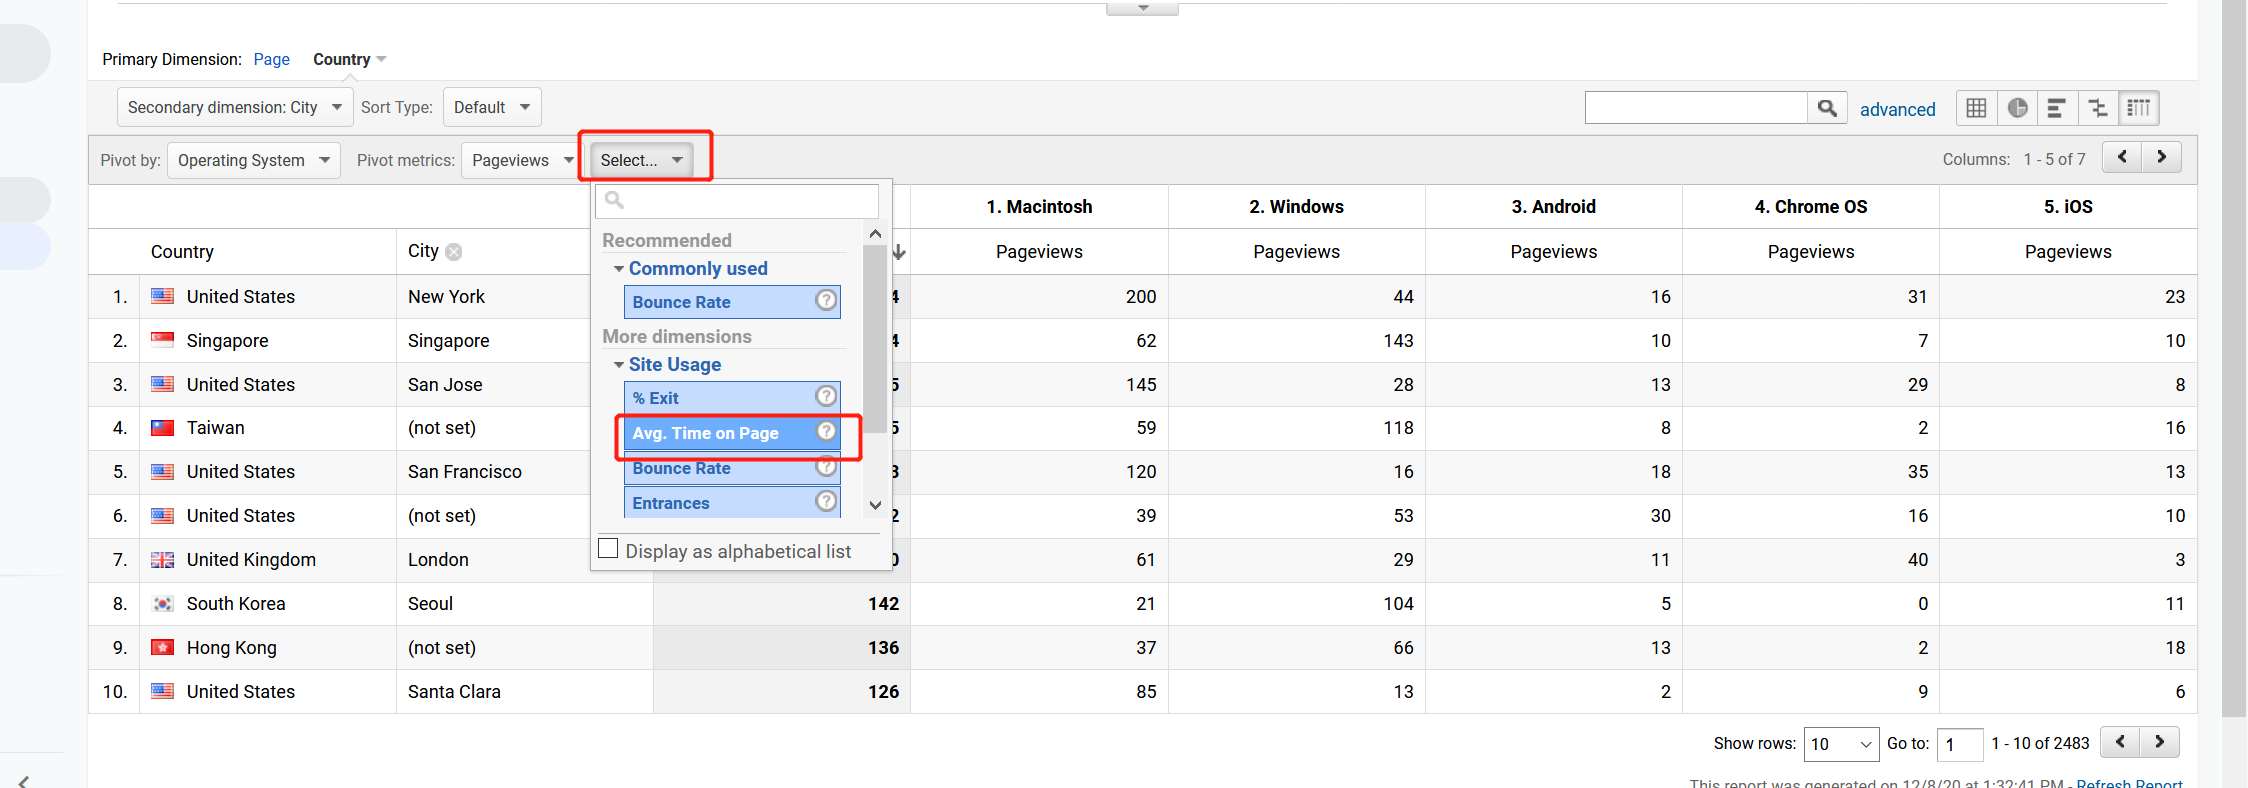
- In the behaviour page, click the right most icon
- Select the operating system ‘pivot by’.
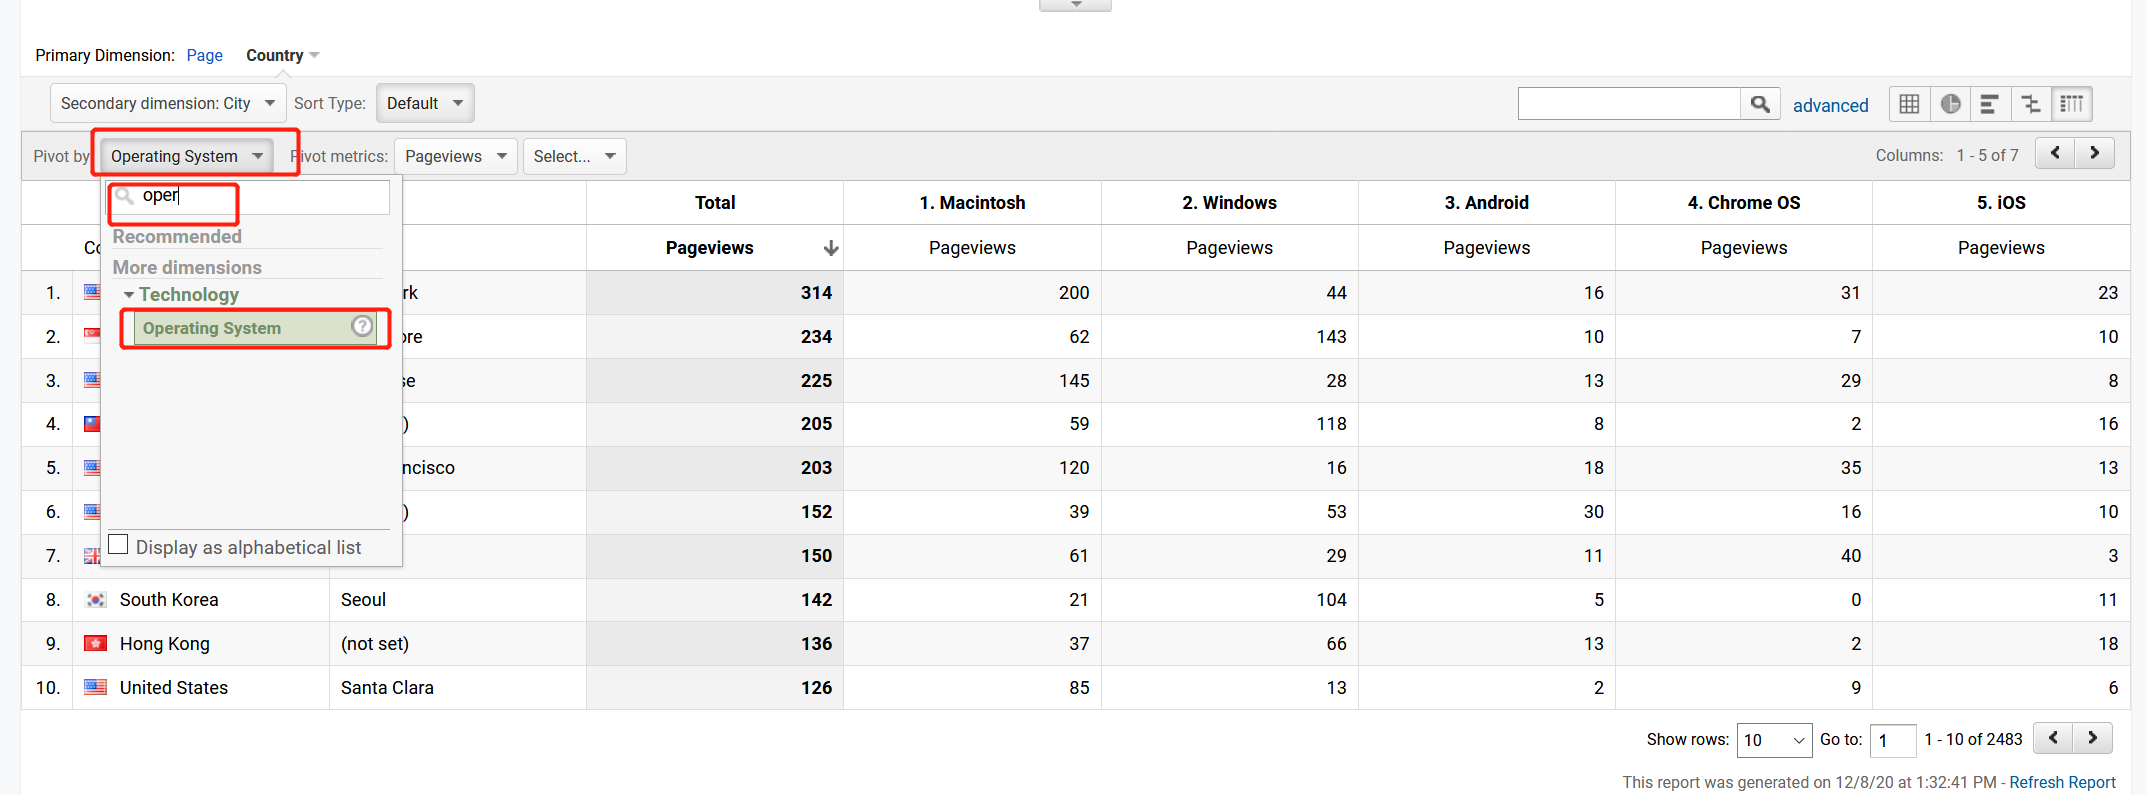
- This is what we got. Note that Android and iOS are for mobile devices.
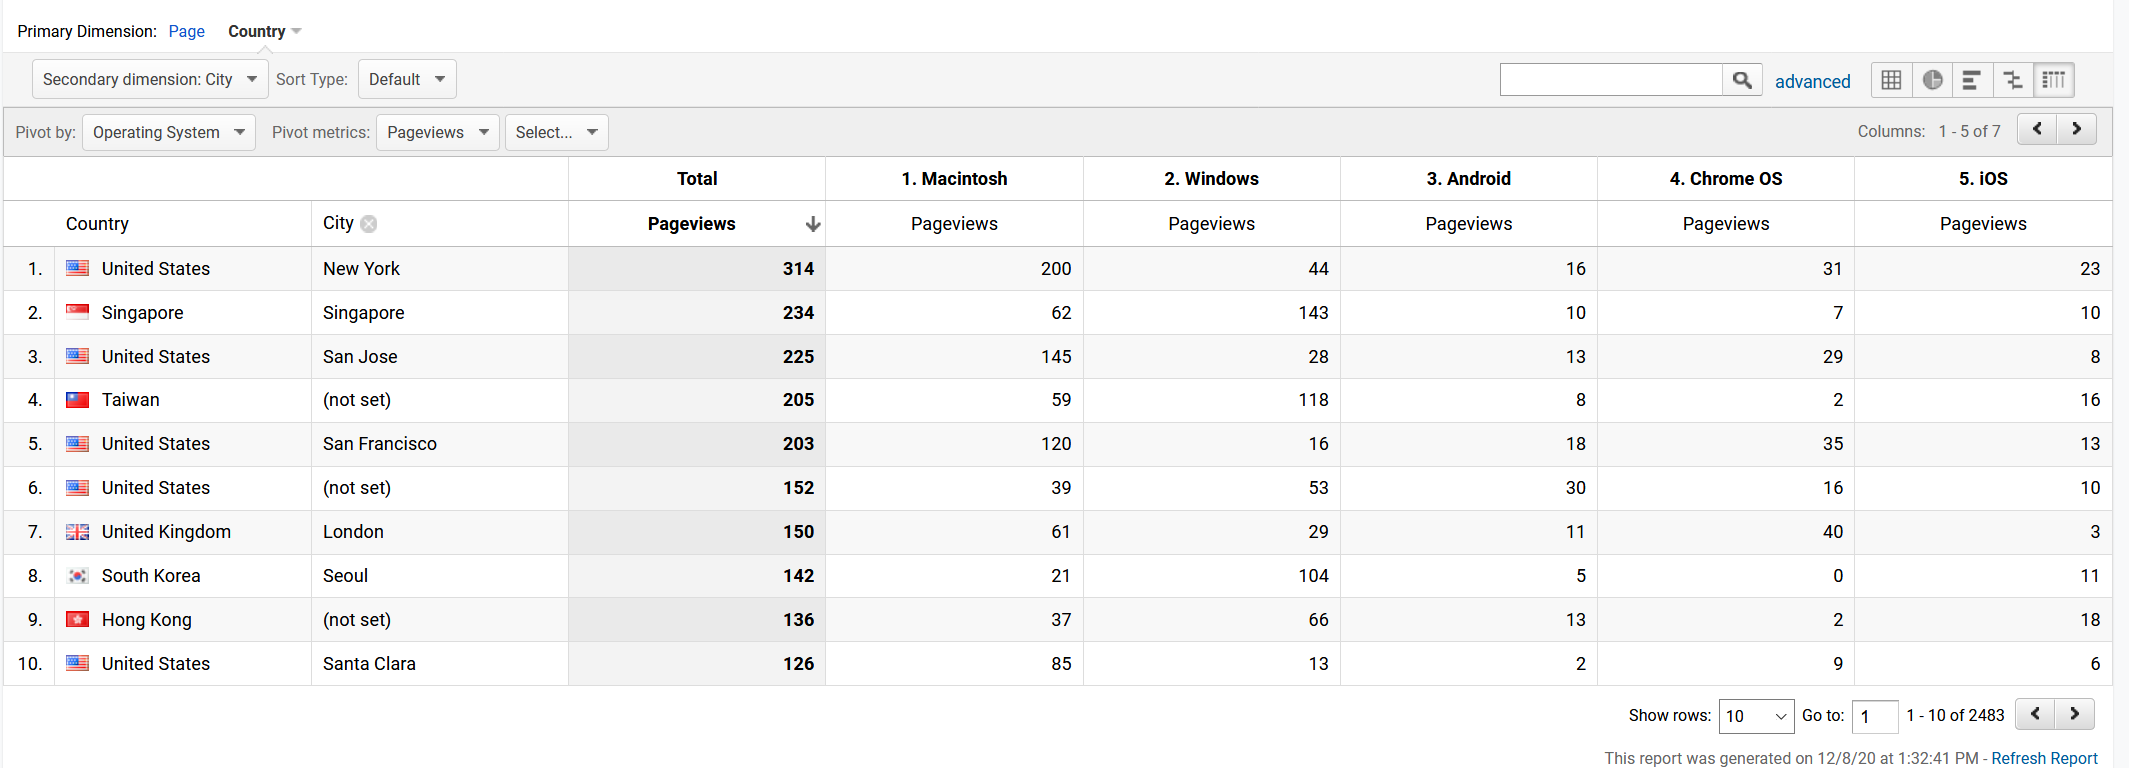
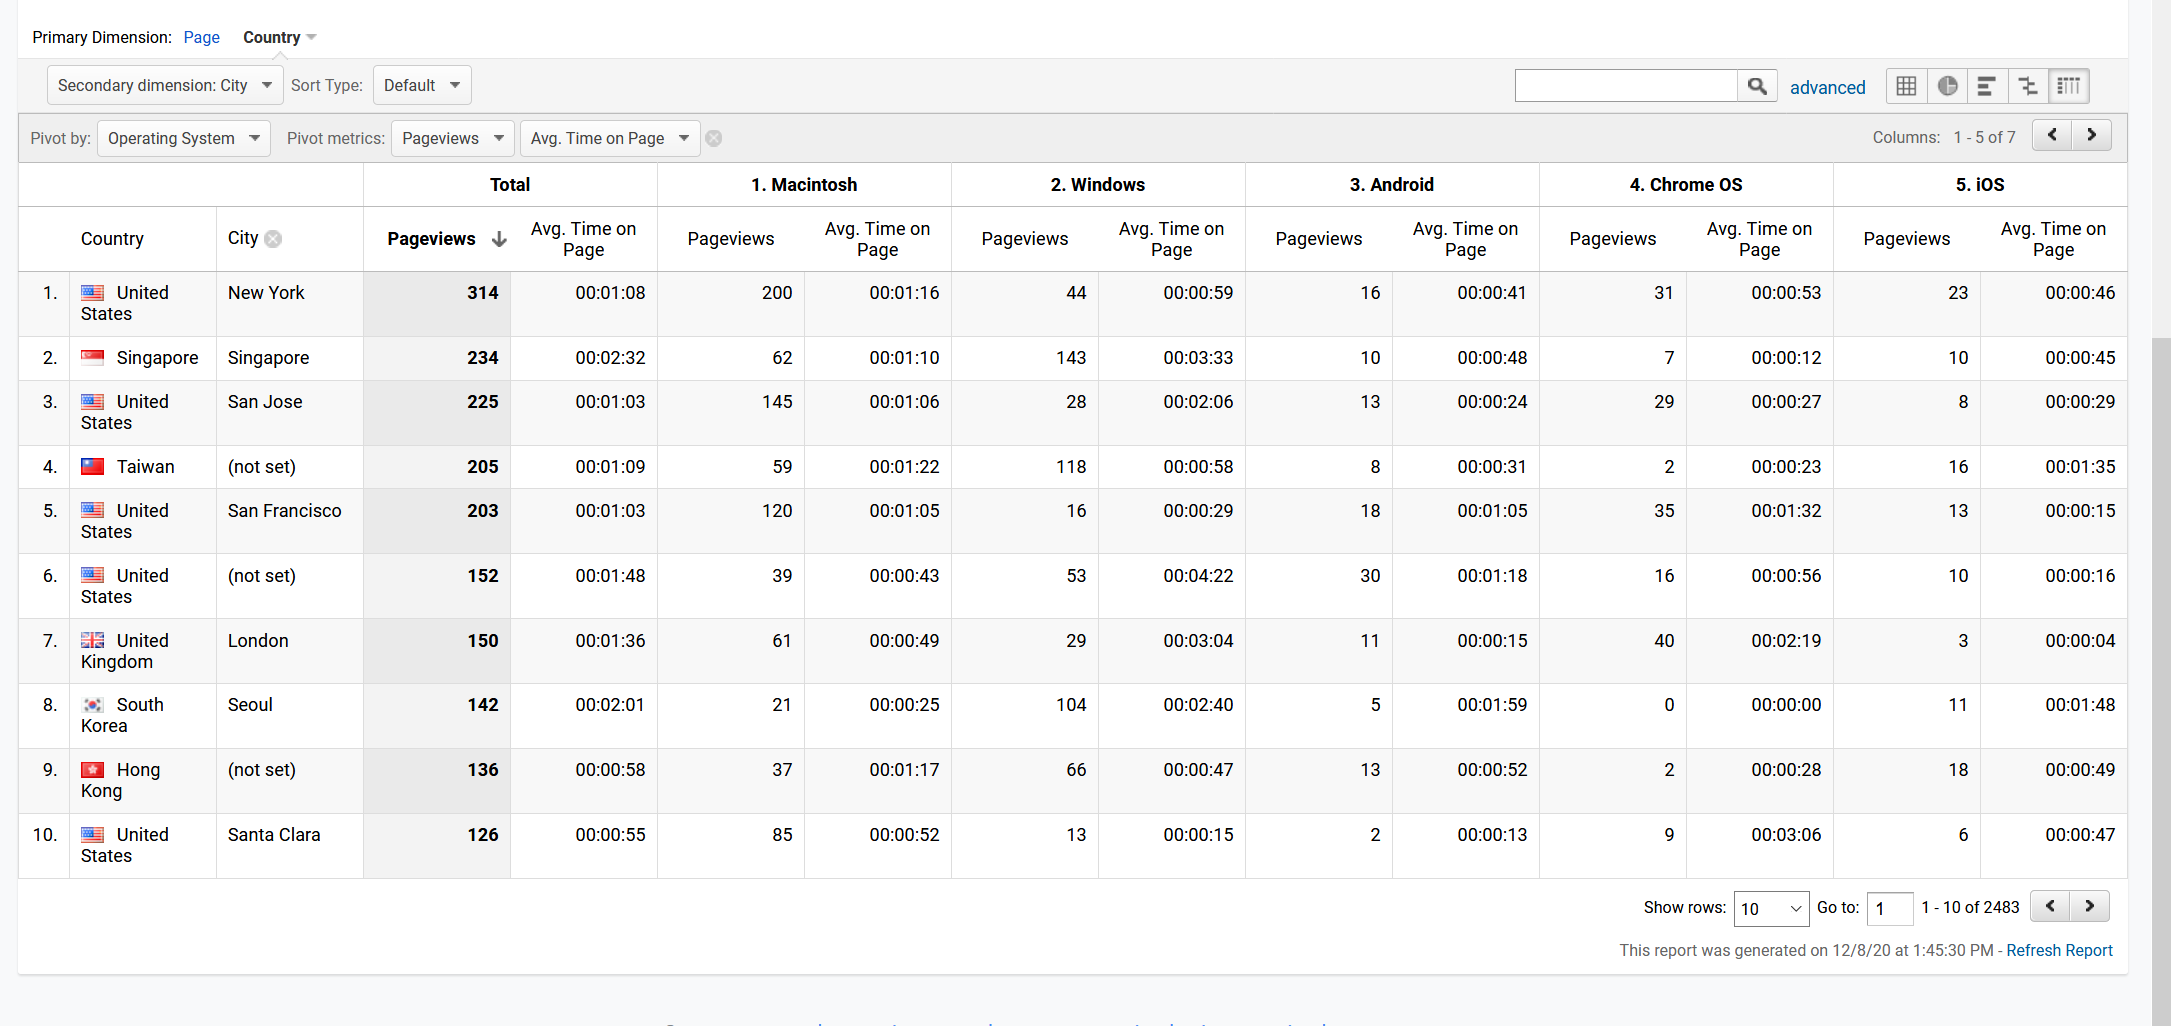
- Since there are three dimensions now, the values to be displayed is more limited. You could
select up to two aggregated value for combination of three dimensions (pivot metric).
- This will be our final result
This should give you some insights of GA, while still being sane :)
If you still think this is a headache, don’t worry, just send us a notice, we would be happy provide help on consultation.